Figure 6.
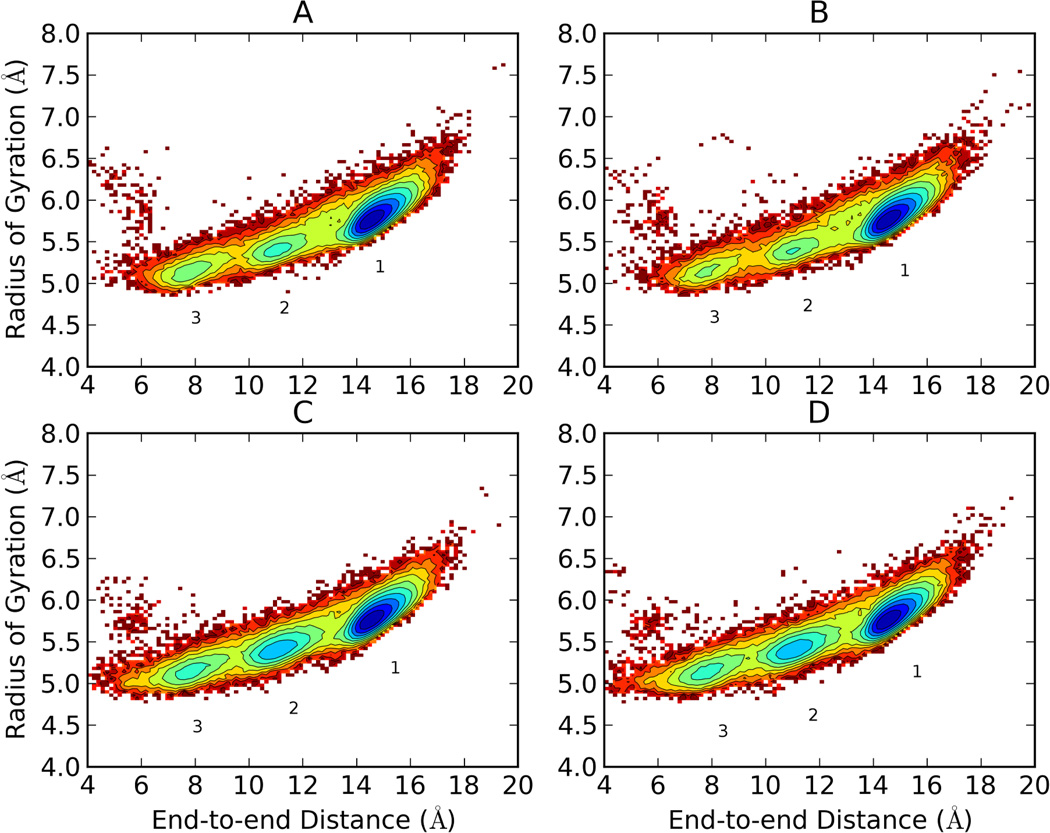
Free energy landscapes of the 300K replica of Ala10 via T-REM (starting from linear (A) and starting from helical (B) conformations) and CSA-nBR-REM (starting from linear (C) and starting from helical (D) conformations) simulations using radius of gyration and end-to-end distances as coordinates. Contour lines are drawn for every 0.5 kcal/mol. Three broad free energy minima were observed for both T-REM and CSA-nBR-REM simulations. The lowest energy conformation (1) has a uniform α-helical conformation. The other minima (2 and 3) still have many residues in helical form but with kinks and turns resulting in a more compact overall structure. There are more observed transitions between minima when CSA-nBR-REM is used.

