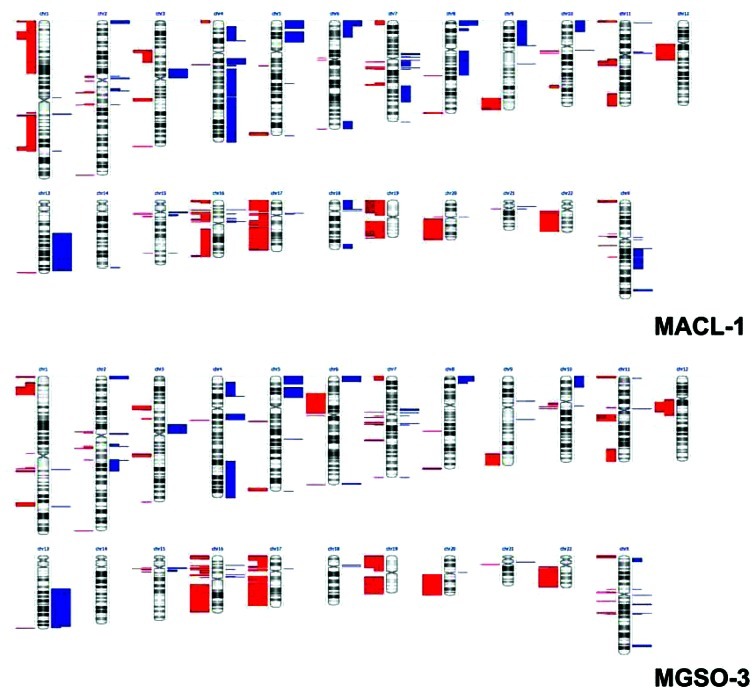
Figure 5.
Whole-genome DNA profile of MACL-1 (top panel) and MGSO-3 cells (bottom panel). DNA profiling performed by Human Genome CGH Microarray 4×180K platform hybridization showed large chromosomal alterations in both cell lines. The red and blue bars represent losses and gains, respectively. Double-length bars represent alterations detected on the 2 swapping dye replicates.

