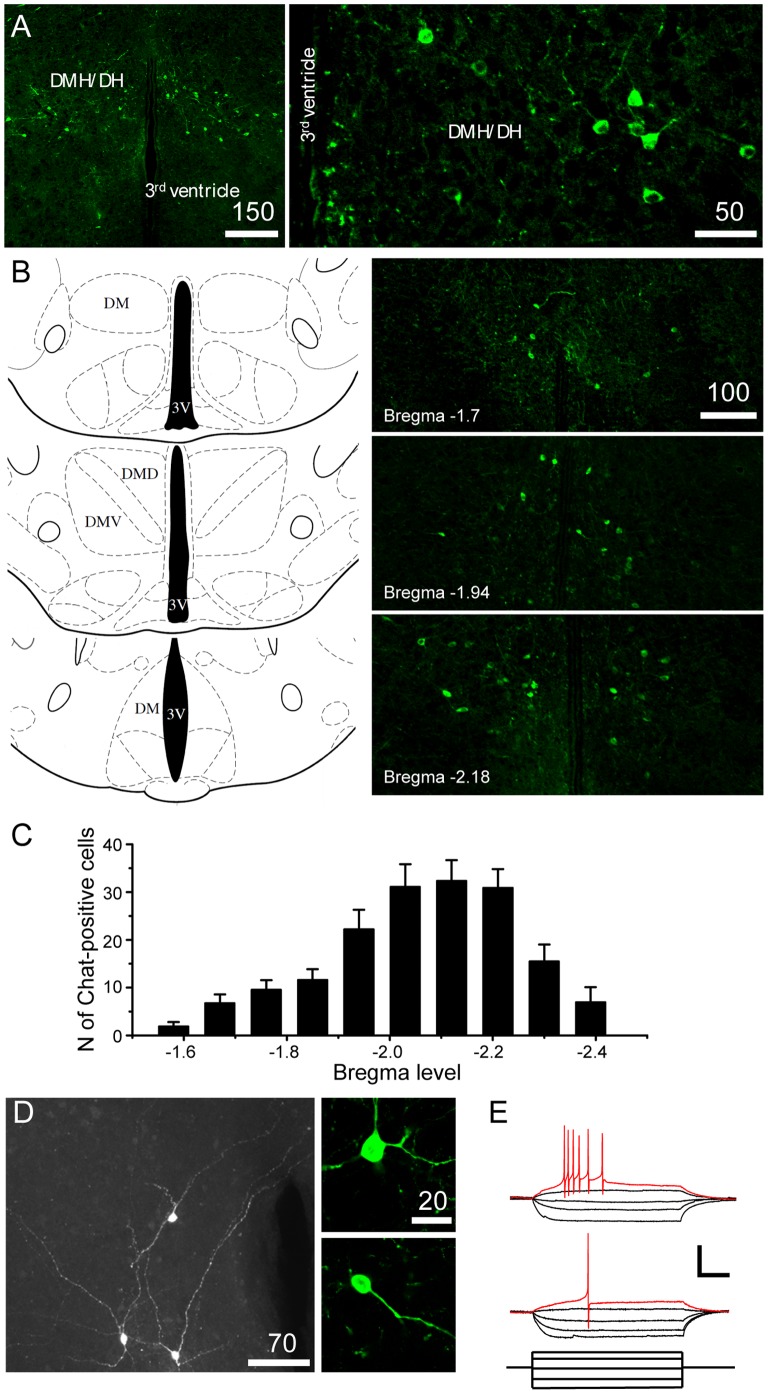
Figure 1. Cholinergic neurons in the DMH.
A. Images of fluorescence microscopy showing the expression of Chat-positive neurons (green) in the DMH of Chat-tauGFP mice. The distribution of cholinergic neurons within the hypothalamus was restricted to the DMH. B. Image of fluorescence microscopy showing the distribution of Chat-positive neurons (green) at three different levels from Bregma (Bregma −1.7, −1.94 and −2.18; Right panel). Left panel: The reference diagrams were adapted from the Mouse Brain Atlas of Paxinos and Franklin (2nd edition, 2001). C. Graph of the number of Chat-positive neurons at the different levels from Bregma. D. Morphology of Chat-positive neurons. Left panel: Immunocytochemical staining combined biocytin labeling of Chat-positive cells. There were two major Chat+ cell types. Right panel: image of fluorescence microscopy of GFP-expressing neurons (upper panel: multipolar-shaped cell, bottom panel: oval or bipolar-shaped cell). E. Responses of Chat-positive neurons to hyperpolarizing and depolarizing current steps. Type I showed a burst of action potentials (upper panel), whereas Type II fired only a single action potential in response to a sustained depolarizing current injection. Scale bar: 50 mV, 100 pA and 100 ms.

