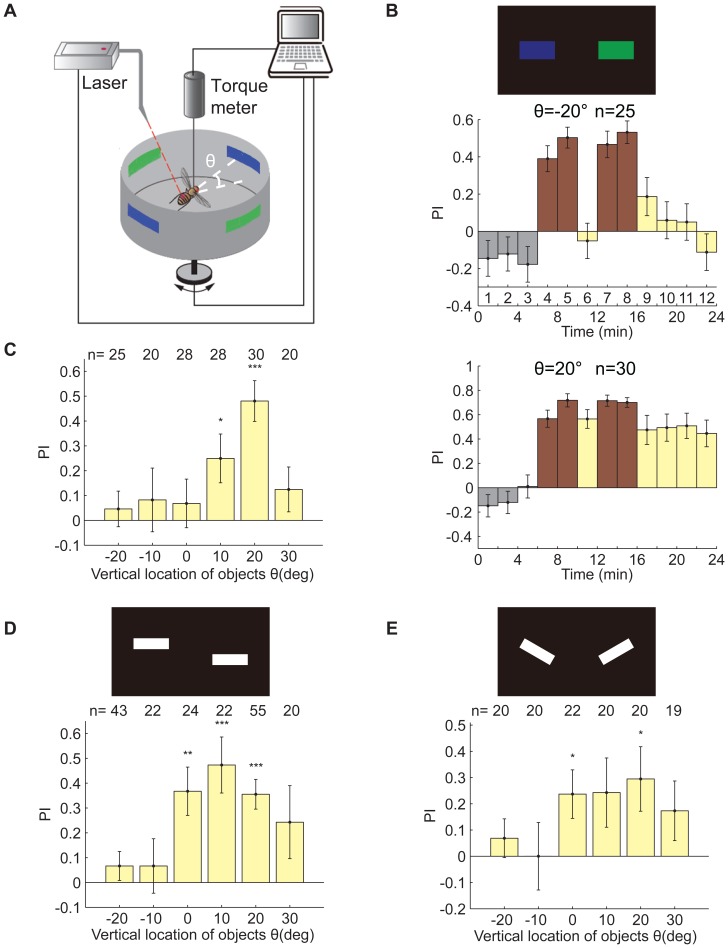
Figure 1. The effect of location on WTB flies' performance for memorizing different visual features.
(A) Schematic of the flight simulator. Θ, elevation angle between the center of the patterns and the tethered fly. (B) Standard 24-min visual operant conditioning experiment to memorize a pair of colors (blue and green). Top panel, patterns used in this experiment. Middle panel, PIs of the flies when the patterns were 20° below them. The flies could not memorize which color was dangerous in this condition. Bottom panel, PIs of flies when the patterns were 20° above them. The flies could memorize which color was dangerous in this condition. (C) Test PIs when color bars were presented on different vertical locations. These PIs demonstrate an obvious location dependence (p = 0.0044). The acute zone for color memorization was 20° above the fly. (D) Top panel, the patterns used in these experiments, which consisted of bars on different vertical locations (ΔCOGs = 18°). Bottom panel, test PIs when these patterns were presented on different vertical locations. These PIs show significant location dependence (p = 0.0012). The acute zone for COGs memorization was 10° above the fly. (E) Top panel, the patterns used in these experiments, which consisted of bars of different contour orientation (ΔOrientation = 60°). Bottom panel, test PIs when these patterns were presented on different vertical locations. These PIs exhibit location dependence. However, this tendency was not significant (p = 0.4485). The acute zone for orientation memorization was 20° above the fly. The data are shown as the mean±SEM; the p values for location dependence were calculated by the Kruskal-Wallis test; significant differences between PIs and zero were calculated by the signed-rank test. * (p<0.05), ** (p<0.01) and *** (p<0.001).

