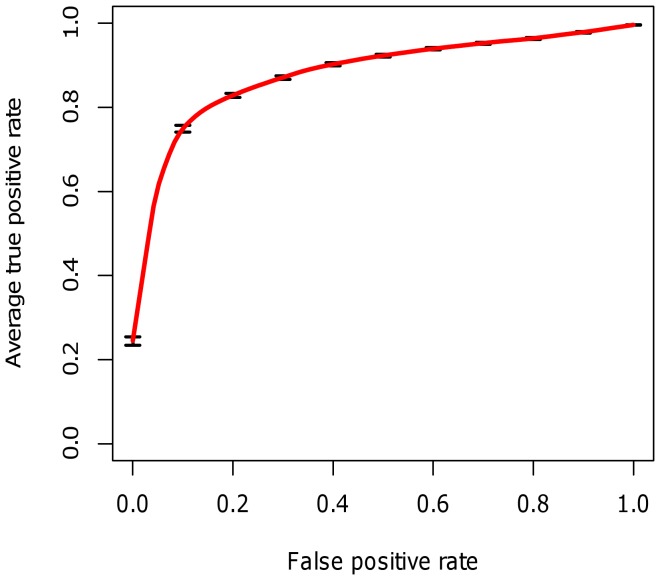
Figure 1. Receiver operating characteristic curve for biomarker-based multivariate models of disease activity in Study II.
Curve shows the average true positive rate across 100 folds of cross validation. In each fold a model was trained on a randomly selected 70% of the data and performance was tested on the remaining 30%.

