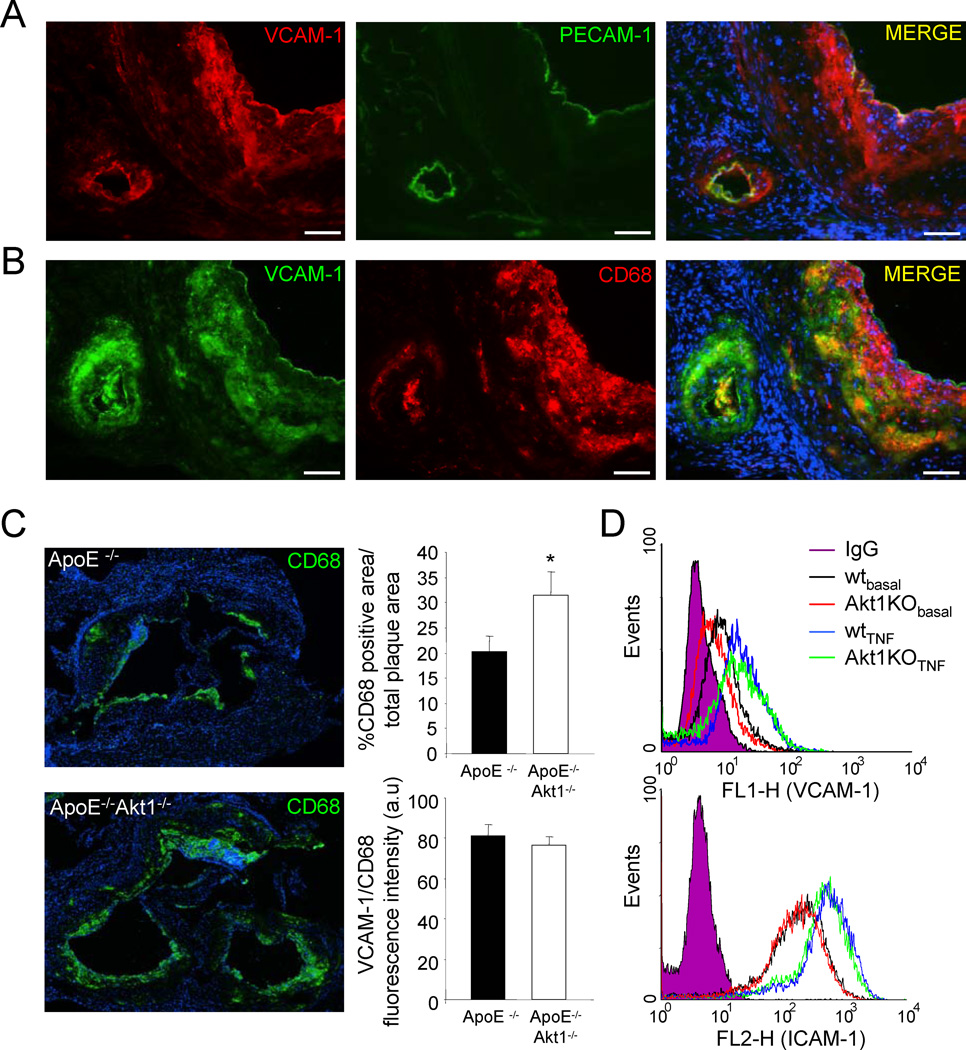
Fig. 7. Increased macrophage infiltration and VCAM-1 expression in the absence of Akt1.
(a-b) Representative examples of cross sections from the aortic sinus labelled for VCAM-1, CD68 and PECAM-1. Bars, 100µm. (c) CD68 positive macrophages in lesions from ApoE−/− and ApoE−/− Akt1−/− mice after 12 weeks of high cholesterol diet were detected by CD68 staining respectively. The data are quantified as CD68 TUNEL positive area versus total lesion area (upper right panel) and the relative fluorescence intensity of VCAM-1 (red channel) in the CD68 positive area (green channel, bottom right panel). (d) VCAM-1 (upper) and ICAM-1 (bottom) expression analysis by flow cytometry in endothelial cells isolated from WT or Akt1 KO mice that were treated with TNFα for 16h. These data are representative of three separate experiments yielding similar results.

