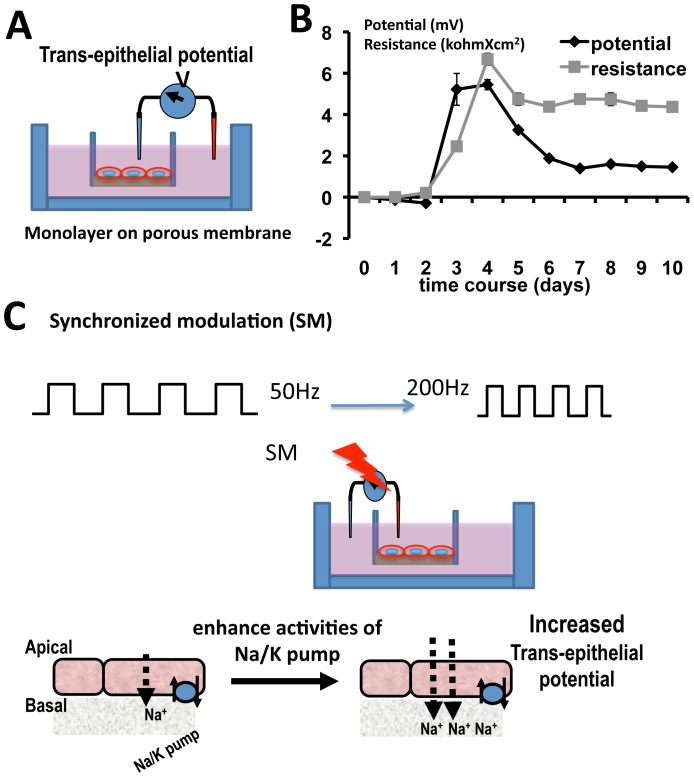
Figure 1. Schematic diagram of synchronization modulation (SM) on transepithelial potentials (TEP).
A. TEP measurements with the insert culture. B. MDCK cells in the insert culture establish TEP and transepithelial resistance (TER), which stabilized ∼6 days in our culture system. Time course of typical TEP and TER. A total of 22 Millipore wells containing MDCK Type 1 cells were monitored each day for 10 days. The TEP and TER are superimposed for comparison. Both recordings peaked at ∼4 days then decreased to stable resting values from day 6–7 onward. An intact monolayer formed at day 3 as the TER started to increase. C. SM forces the Na/K pumps to work at higher rates and causes a greater net flow of Na (positive charges) to the basal side. In a polarized epithelium where the Na/K pump is localized almost exclusively on the basolateral membrane, SM results in increases in the transepithelial potential. Fig. 1B n = 22 for all data points.

