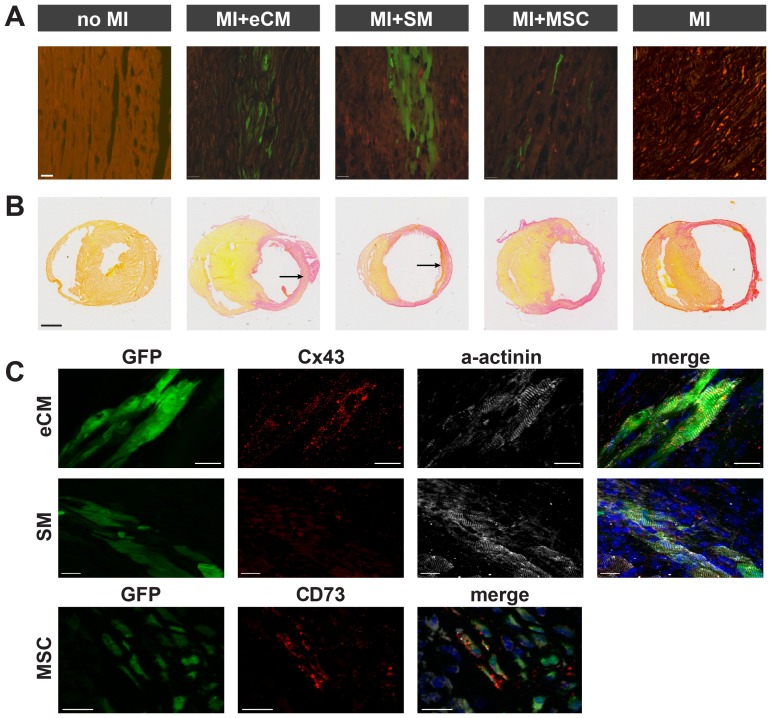
Figure 1. Fluorescence microscopy and histology of myocardial tissues of treatment and control groups.
A) Ex vivo fluorescence microscopy of GFP expressing eCMs, SMs and MSCs two weeks after transplantation in infarcted myocardium to evaluate cell engraftment and survival. GFP is depicted in green and autofluorescence is shown in red. Scale bar = 20 µm. B) Ex vivo picrosirius red staining to determine general infarct composition two weeks postoperatively. Engrafted eCMs and SMs can be identified within the lesion (arrows). Scale bar = 1 mm. C) Ex vivo fluorescence microscopy to evaluate cell differentiation at 7 weeks (no MI, MI+eCM, MI+SM, MI) or 2 weeks (MI+MSC) after surgery and transplantation. For all groups, GFP fluorescence is depicted in green and cell nuclei in blue. For eCM (top) and SM (middle) the cardiomyocyte marker Connexin43 is shown in red and α-actinin in white, whereas for MSC (bottom) the mesenchymal stem cell marker CD73 is shown in red. Scale bars = 20 µm.

