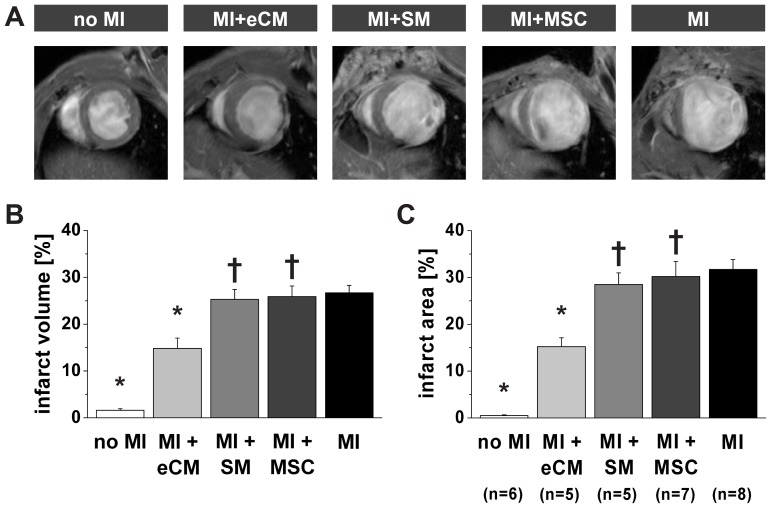
Figure 2. Quantification of infarct size by MRI.
A) Representative in vivo T1-weighted mid-LV short-axis LGE MR-images two weeks after myocardial infarction for each experimental group. Infarct size was quantified from LGE images as B) relative transmural infarct volume and C) relative epicardial infarct surface area. No MI: n = 6, MI+eCM: n = 5, MI+SM: n = 5, MI+MSC: n = 7 and MI: n = 8. * = p<0.05 vs. MI, † = p<0.05 vs. MI+eCM. The infarct volume and area measured in wild type mice (no MI) was indicative for the accuracy of the analysis.

