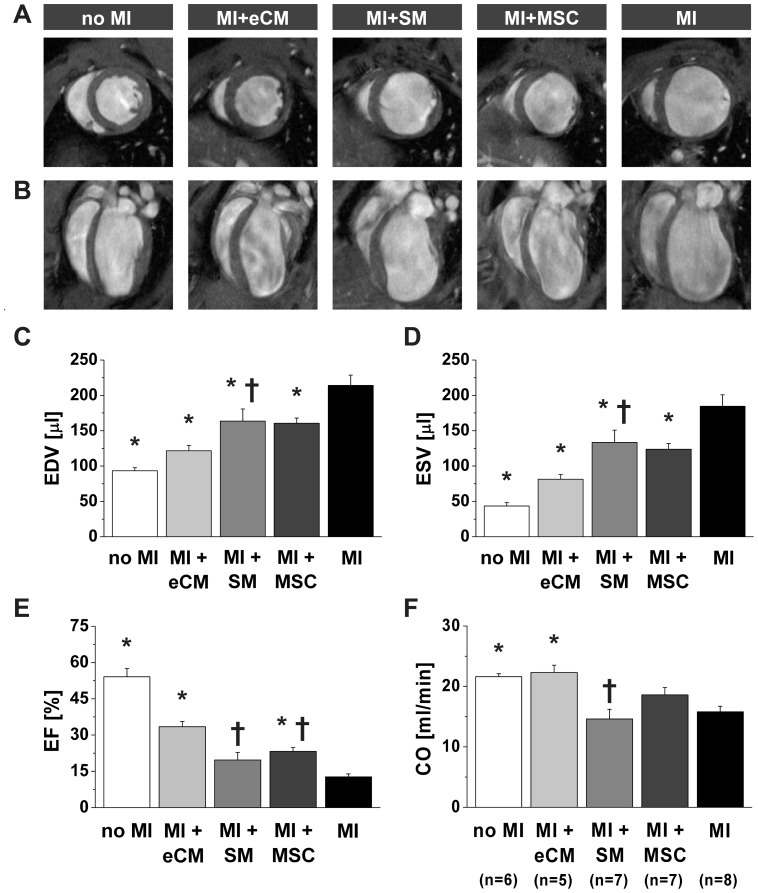
Figure 3. Quantification of cardiac function by MRI.
Representative in vivo end-diastolic MR-images two weeks after myocardial infarction in A) short-axis (mid-LV) and B) long-axis orientation for each experimental group. Global cardiac morphology and function were obtained from in vivo cine MR-images: C) EDV, D) ESV, E) EF and F) CO. No MI: n = 6, MI+eCM: n = 5, MI+SM: n = 7, MI+MSC: n = 7 and MI: n = 8. * = p<0.05 vs. MI, † = p<0.05 vs. MI+eCM.

