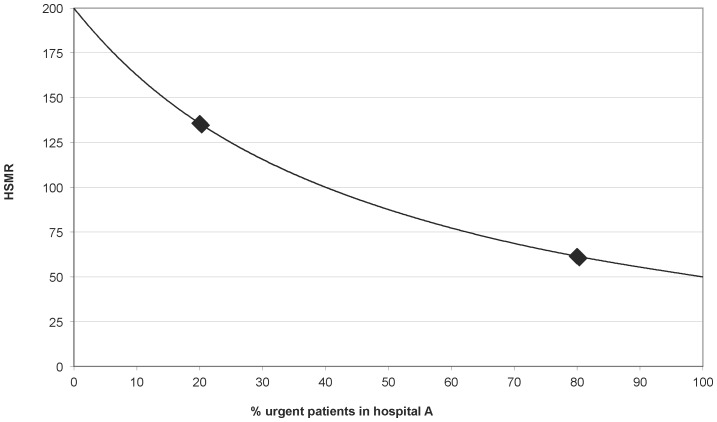
Figure 1. Change in HSMR when the ratio of urgently vs. non-urgently admitted patients changes.
The observed mortality rates are 3% and 4% for respectively urgently and non-urgently admitted patients. The expected rates are 6% and 2%, implying the presence of statistical interaction between hospital and urgency, which is ignored in the adjustment model. Markers indicate the proportions of urgently admitted patients used in the theoretical example (20% and 80% respectively).

