
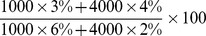
Table 1. Numerical Example of direct and indirect standardization.
| Hospital A | Hospital B | |||
| Urgent | Non-urgent | Urgent | Non-urgent | |
| Expected mortality rate | 6% | 2% | 6% | 2% |
| Observed mortality rate | 3% | 4% | 3% | 4% |
| Case-mix | 1000 | 4000 | 4000 | 1000 |
| Indirect standardization | 136 | 61 | ||

|
|
|||
| Direct standardization | 100 | 100 | ||

|
|
|||
Although both hospitals have the same observed mortality hospital A performs worse than hospital B when the mortality rate is adjusted via the indirect standardization method.