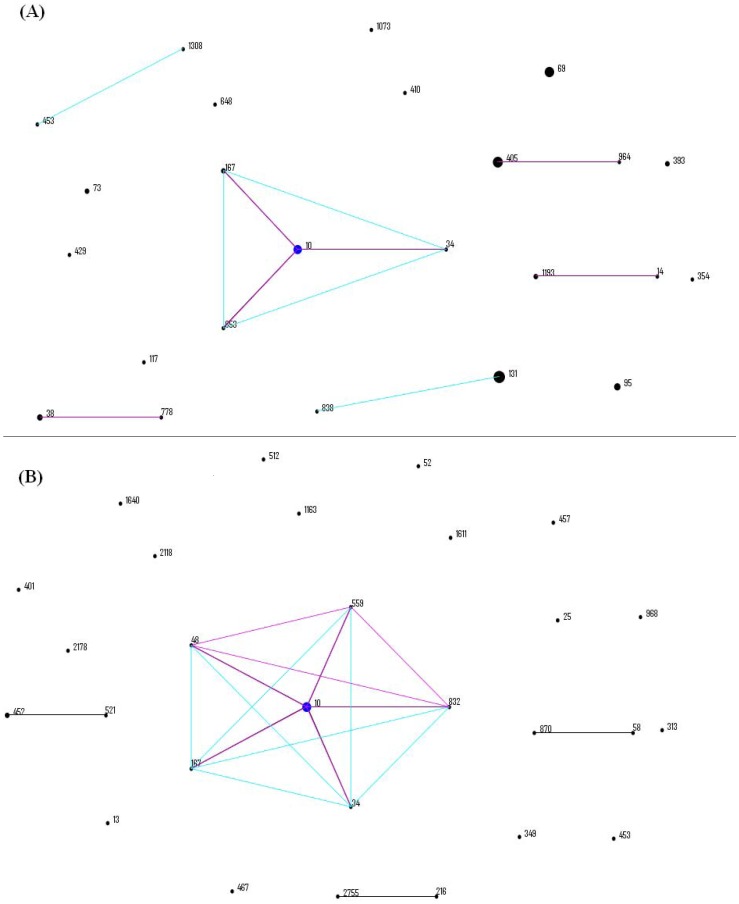
Figure 1. eBURST diagrams of UPECand intestinal commensal isolates showing related STs and individual STs.
(A) referred to UPEC isolates and (B) referred to intestinal commensal isolates. Each ST is represented by a circle, the size of which correlates to the frequency of the ST. Predicted founders are positioned centrally and shown in blue, and single-locus variants and double-locus variants are shown in pink and blue, respectively.

