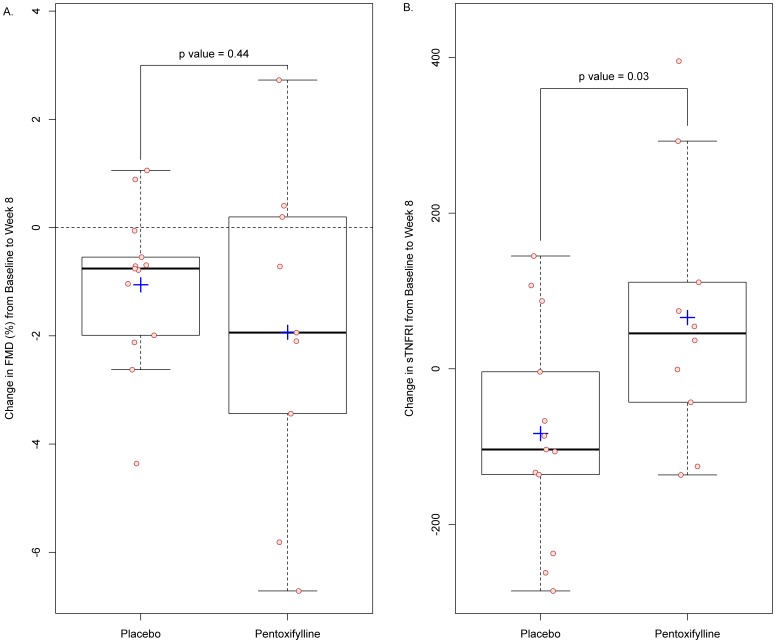
Figure 2. Changes in flow-mediated dilation (FMD) of the brachial artery and soluble tumor necrosis factor receptor-1 (sTNFRi) from baseline to week 8.
Panel A shows the changes in FMD; Panel B shows the changes in sTNFRI. Circles indicate actual values. Top and bottom of boxes indicate 75th and 25th percentiles, respectively. Internal horizontal lines indicate median values and plus-signs indicate mean values. External horizontal lines/whiskers indicate 25th or 75th percentiles ± (1.5 times interquartile range).

