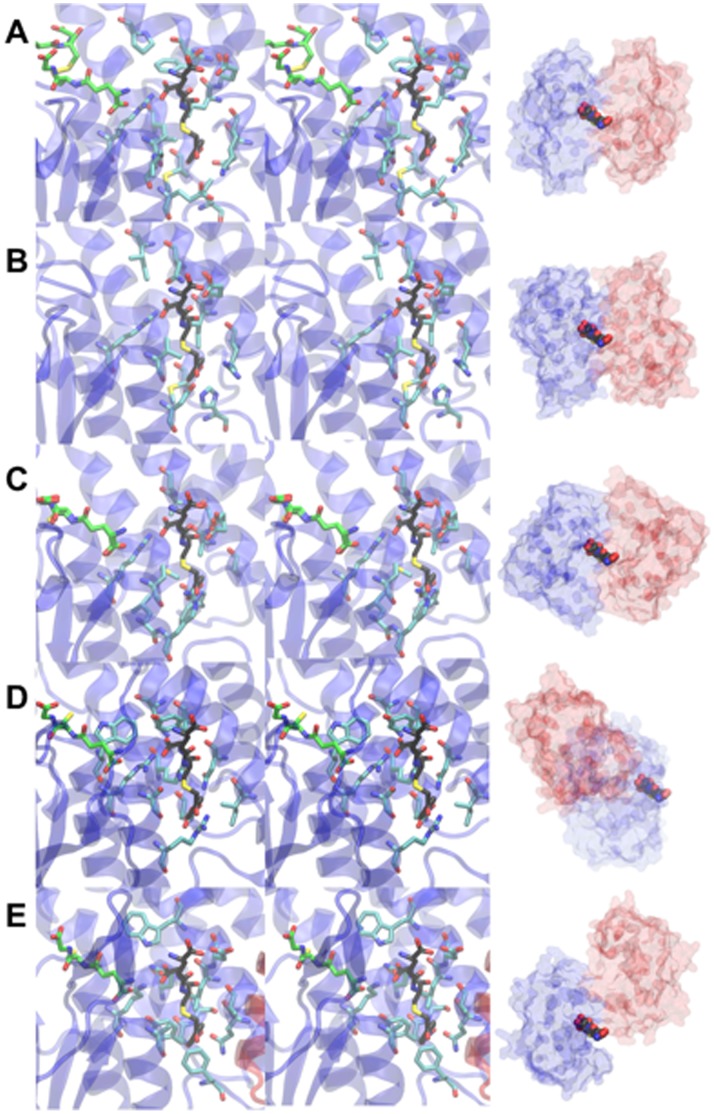
Figure 6. Comparison of the hGSTO1-1 L-site with related GSTs.
Stereodiagrams of the L-site of hGSTO1-1 and equivalent sites in related GST are shown at left. Single monomers are shown in cartoon form with the second monomer omited for clarity. 4NPG (black carbon atoms), GSH (green carbon atoms) and L-site residues (or equivelent)(cyan carbon atoms) are shown in stick form. As a reference point, the model of 4NPG from the complex with hGSTO1-1 is shown overlaid in all structures. At right are shown transparent molecular surfaces of each GST with monomers in blue and red, and the model of 4NPG included as a reference point. The structures shown are (A) hGSTO1-1, (B) Bombyx mori GSTO3-3 (PDB 3RBT), (C) Sphingobium sp. SYK-6 LigG (PDB 4G10), (D) Phanerochaete chrysosporium GSTO3-3 (PDB ID 3PPU), (E) Phanerochaete chrysosporium GSTFuA (PDB 4G19).

