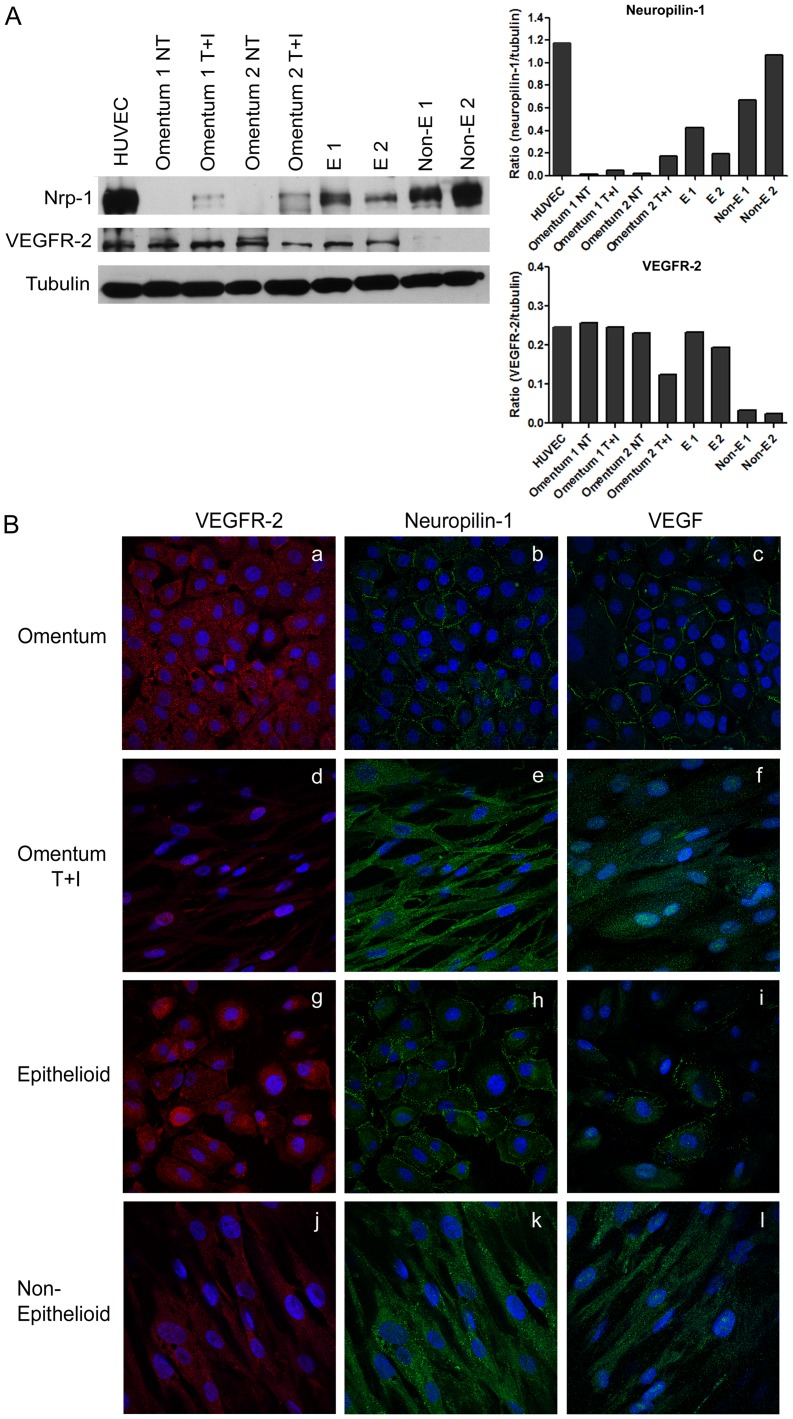
Figure 5. Expression levels and cellular distribution of Nrp-1 and VEGFR2 proteins during in vitro and ex vivo MMT.
(A) Western blots show the expression levels of Nrp-1 and VEGFR-2 in total cell lysates during in vitro and ex vivo MMT. Expression of α-tubulin is employed as a loading control. Human umbilical vein endothelial cells (HUVEC) are used as a positive control. The histograms depict the quantification of Nrp-1 and VEGFR2 levels compared with α-tubulin. Data are representative of 5 samples for each condition from PD patients and omentum samples included in the study. (B) The expression of Nrp-1, VEGFR-2, and VEGF was analyzed by immunofluorescence microscopy in omentum and effluent-derived MCs. MCs were double stained for Nrp-1 (green) and VEGFR-2 (red), and single stained for VEGF (green). Nuclei were stained with DAPI. Nrp-1 and VEGF show a membrane distribution in omentum and epithelioid MCs (b, c, h, i). During in vitro (e, f) and ex vivo (k, l) MMT both proteins change their localization and are internalized. The expression of VEGFR-2 is down-regulated but it does not show differences in localization during in vitro (a, d) and ex vivo (g, j) MMT.

