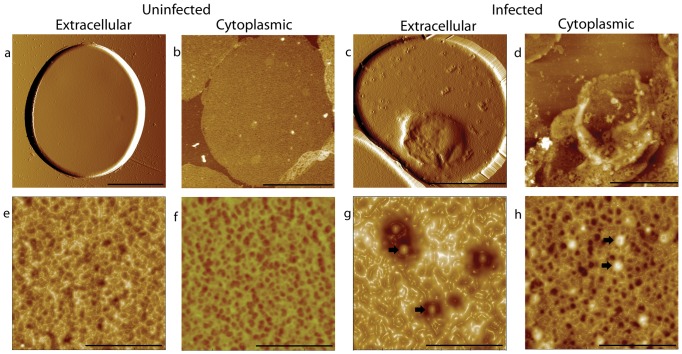
Figure 1. AFM images of the outer and inner surface of uninfected and infected erythrocytes.
(a) Intact uninfected erythrocyte; (b) cytoplasmic-surface-exposed uninfected erythrocyte membrane (one layer); (c) Intact trophozoite stage infected erythrocytes; (d) cytoplasmic-surface-exposed trophozoite stage infected erythrocyte membrane (one layer); (e-f) Plot view of high magnification of (e) uninfected erythrocyte membrane outer surface, (f) uninfected erythrocyte membrane inner surface, (g) infected erythrocyte membrane outer surface and (h) infected erythrocyte membrane inner surface. Knobs were indicated by black arrows. Bars: 4 µm (a-d); 500 nm (e-h).

