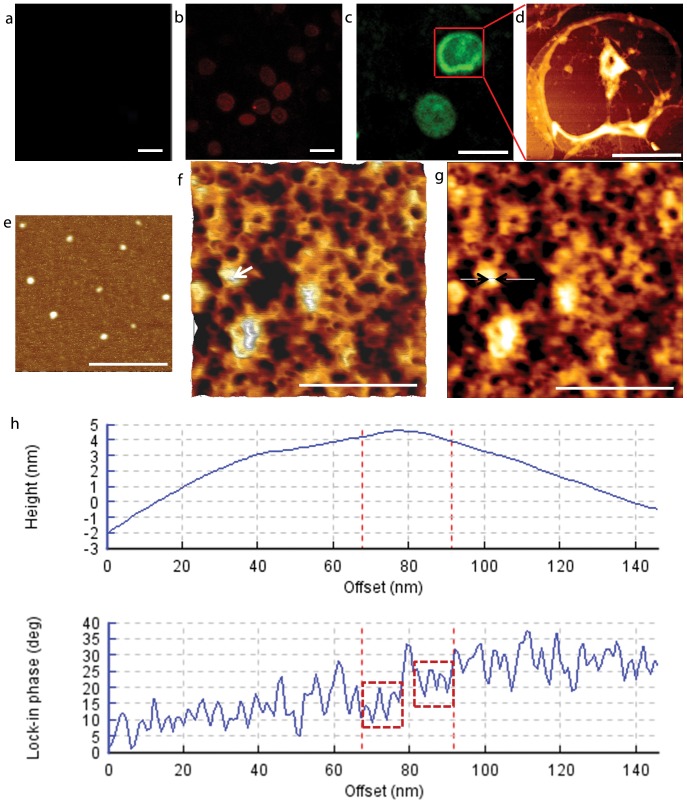
Figure 2. QDs targeting the cytoplasmic surface of infected erythrocyte membrane proteins.
(a) No primary antibody and QDs only for control. (b) Mouse anti-spectrin followed by goat anti-mouse Fc-conjugated QD605; (c) Rabbit anti-KAHRP followed by goat anti-rabbit Fc-conjugated QD525; (d) Interested area from (c) was imaged using AFM; (e) AFM image of QD525 on cover slips; (f) Plot view of high magnification of QDs targeted KHARP proteins (zoomed from d), a QD is indicated by a white arrow; (g) AFM height image of the same area as (f), a short section of 79.34 nm through the QD was indicated by a white line with two black head to head arrowheads; (h) The height and the lock-in phase plot of the section draw in (f), the QD was verified by the pattern of the phase plot between the two red dash lines, where the negative shifts at the peripheral part of the QD indicated by two dashed red boxes, confirmed that this particle was a QD [37]. Bars: 10 µm (a-c); 4 µm (d); 400 nm (e); 500 nm (f & g).

