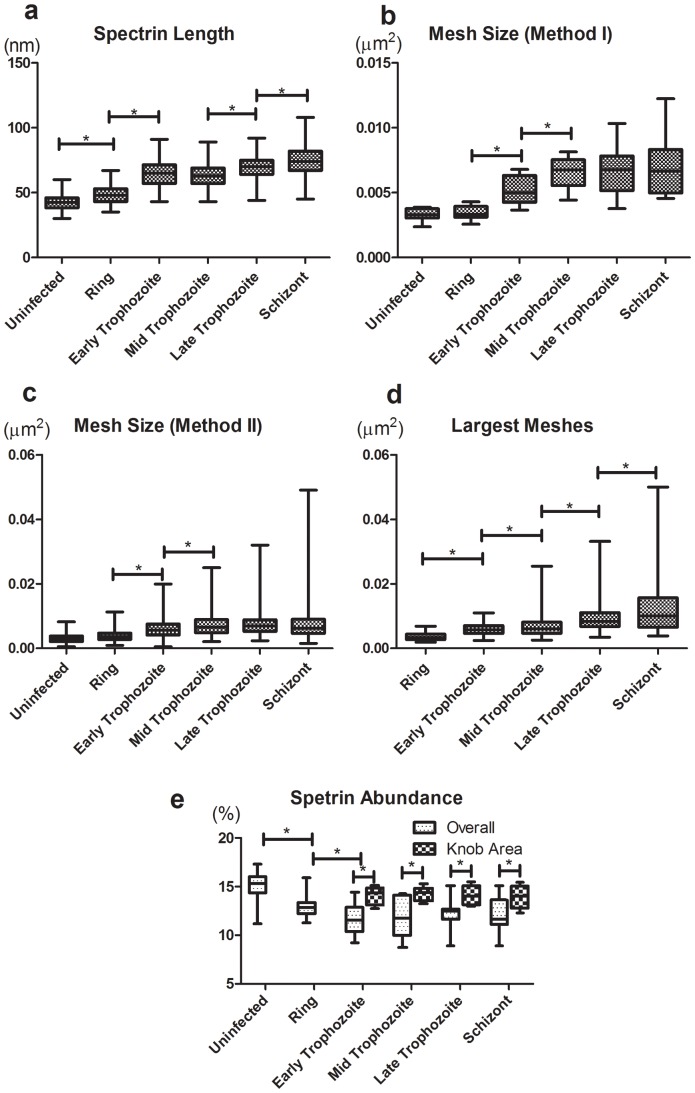
Figure 4. Statistical analysis of the spectrin networks at different infection stages.
(a) The spectrin length (n = 100, 100, 170, 110, 120, 110 for uninfected, ring, early trophozoite, mid trophozoite, late trophozoite and schizont respectively); (b) The mesh size (Mi) using Method I at different stages (n = 9, 10, 19, 11, 30, 10 for uninfected, ring, early trophozoite, mid trophozoite, late trophozoite and schizont respectively); (c) The mesh sizes using Method II; (d) The largest mesh sizes (n = 100 for all the stages); (e) Spectrin abundance (overall and at knob areas) (Csn) (n = 10, 10, 15, 15, 17, 9 for uninfected, ring, early trophozoite, mid trophozoite, late trophozoite and schizont respectively). * P<0.001; ** P<0.005; *** P<0.05 (ANOVA for a, b, c and e; Kolmogorov-Smirnov Test for d).

