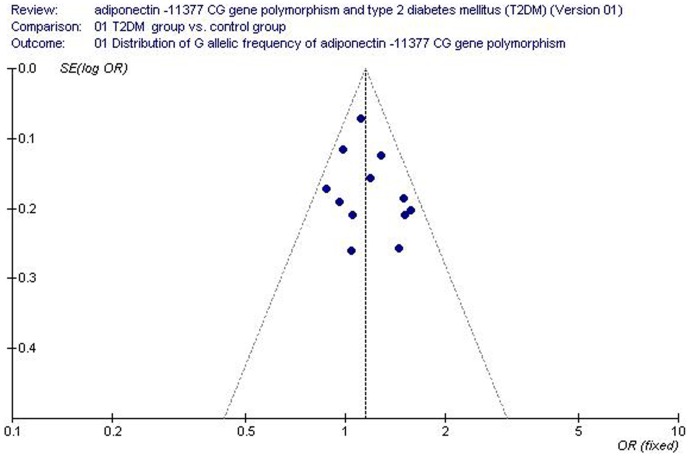
Figure 8. Funnel plot for studies of the association of T2DM associated with adiponectin −11377 CG gene polymorphism under an allelic genetic model (distribution of G allelic frequency of adiponectin −11377 gene).
The horizontal and vertical axis correspond to the OR and confidence limits. OR: odds ratio; SE: standard error.

