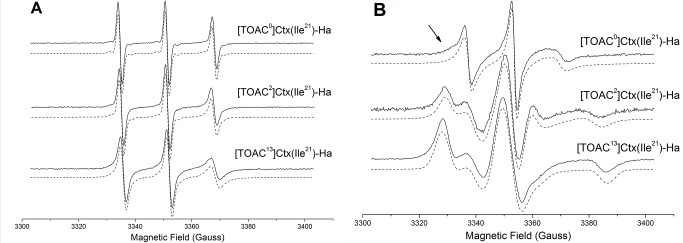
Figure 6. ESR spectra (solid lines) of the TOAC-labeled peptides and the best nonlinear least-squares fits (dashed lines) in aqueous solution (A) and LPC micelles (B) acquired at 22°C.

The concentration of the peptide was 80 µmol L−1.

The concentration of the peptide was 80 µmol L−1.