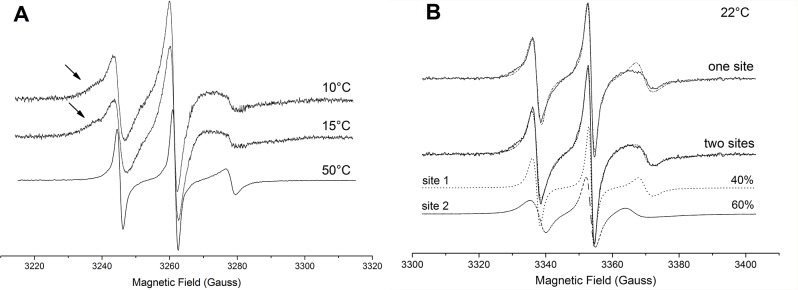
Figure 7. Representative ESR spectra acquired at 10, 15, and 50°C corresponding to a dynamic equilibrium between the membrane-bound and membrane-unbound N-terminal conformations (A).

Note the heightening of the spin population experiencing a more restricted re-orientational motion at low temperatures. [TOAC0]Ctx(Ile21)-Ha ESR spectrum in LPC micelles (solid lines) acquired at 22°C and the best nonlinear least-squares fits (dashed lines) using one (top) or two (bottom) spectral components (B).
