
Figure 2.
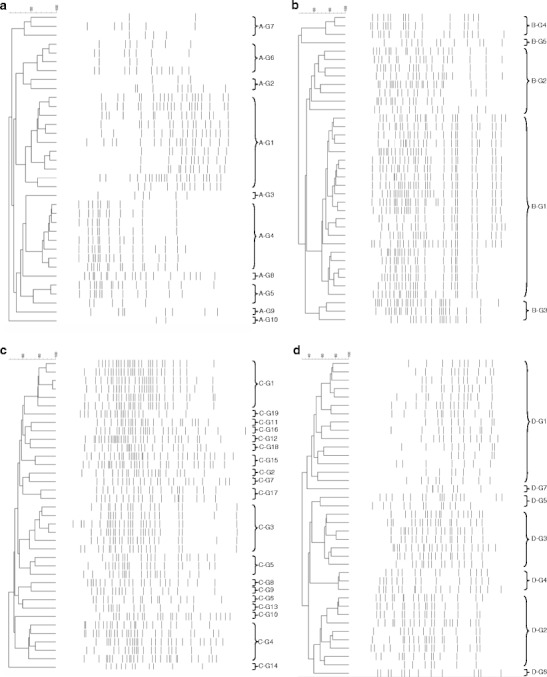
Dendrogram obtained from GTG5-PCR fingerprint of the surface bacterial isolates from TSA added 4.0 % (w/v) NaCl. a Dairy A, b Dairy B, c Dairy C and d Dairy D. The identification of the groups can be seen in Table 4
Official websites use .gov
A
.gov website belongs to an official
government organization in the United States.
Secure .gov websites use HTTPS
A lock (
) or https:// means you've safely
connected to the .gov website. Share sensitive
information only on official, secure websites.
Dendrogram obtained from GTG5-PCR fingerprint of the surface bacterial isolates from TSA added 4.0 % (w/v) NaCl. a Dairy A, b Dairy B, c Dairy C and d Dairy D. The identification of the groups can be seen in Table 4