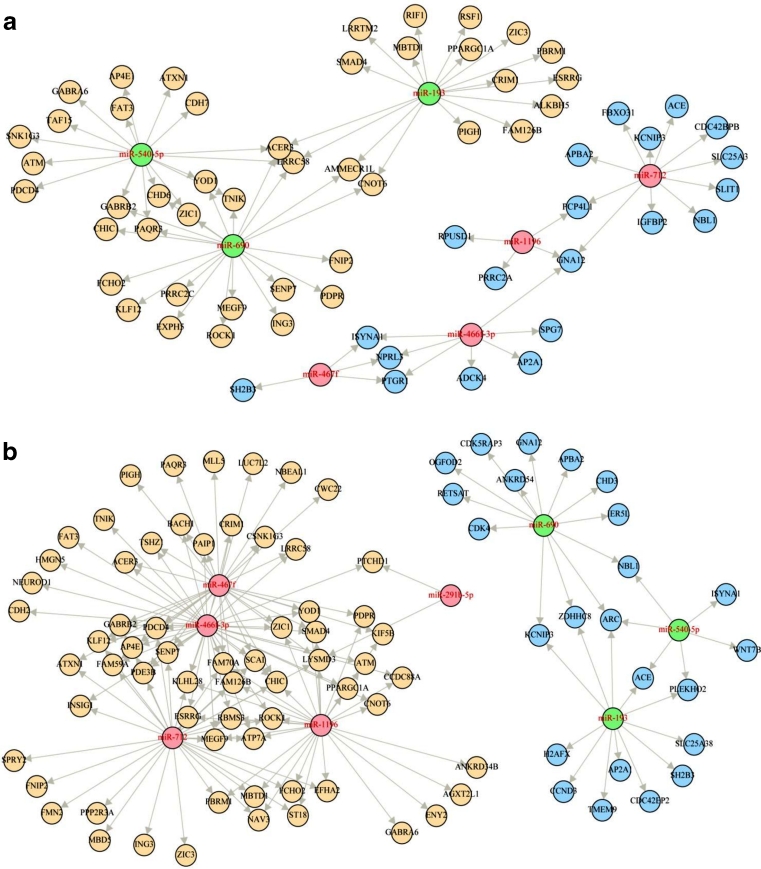
Fig. 2.
Potential miRNA–mRNA regulatory networks identified in the olanzapine treatment group. Predicted miRNA target genes identified as significantly differentially expressed were identified. The strength of the potential miRNA–mRNA interactions was assessed in regard to correlation of miRNA to mRNA expression values using the BN-SA method. Those interactions reported with strong correlation with a high confidence comment are pictured here. a Negatively correlated interactions. b Positively correlated interactions. (pink upregulated miRNA, green downregulated miRNA, blue downregulated mRNA, yellow upregulated mRNA)

