Fig. 1.

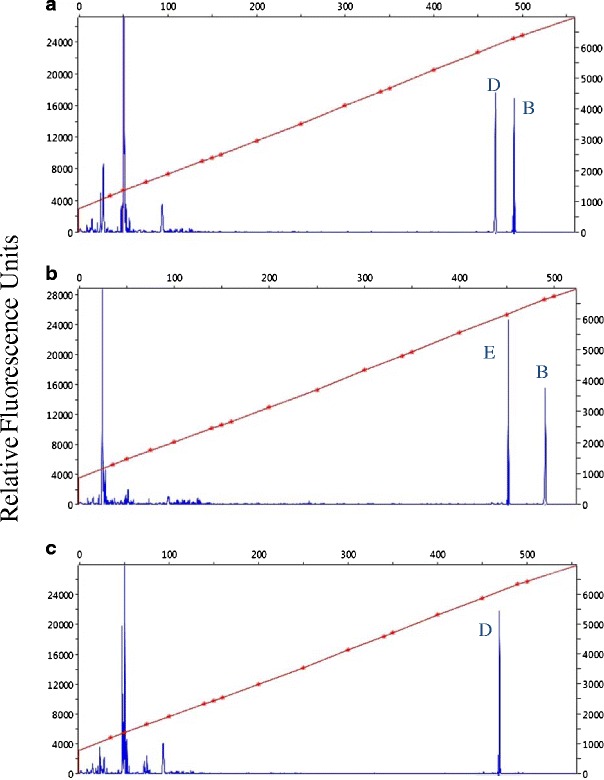
Fluorescence profile for three IGS genotypes of A. areolatum. The peaks on the far right are IGS fragments. a Peaks for B and D, b peaks for B and E, c peak for D alone

Fluorescence profile for three IGS genotypes of A. areolatum. The peaks on the far right are IGS fragments. a Peaks for B and D, b peaks for B and E, c peak for D alone