
Fig. 2.
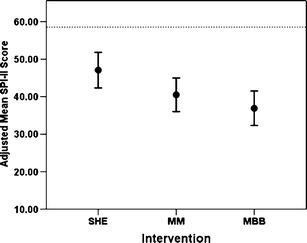
Primary outcome indicator, the adjusted means of MOS-SS Sleep Problems Index II (SPI-II), averaged over all time points in the three groups, with 95 % confidence interval (CI). Here, “adjusted” means “adjusted for baseline scores,” allowing the outcome indicators to be directly compared with one another. Both MM and MBB were found to be lower than SHE (p = .0499 and p = .0029 respectively). Note that the CIs depicted here are not those CIs actually used in the linear mixed model analysis. A dashed horizontal line in represents the mean baseline covariate value, representing a common baseline reference across the three groups