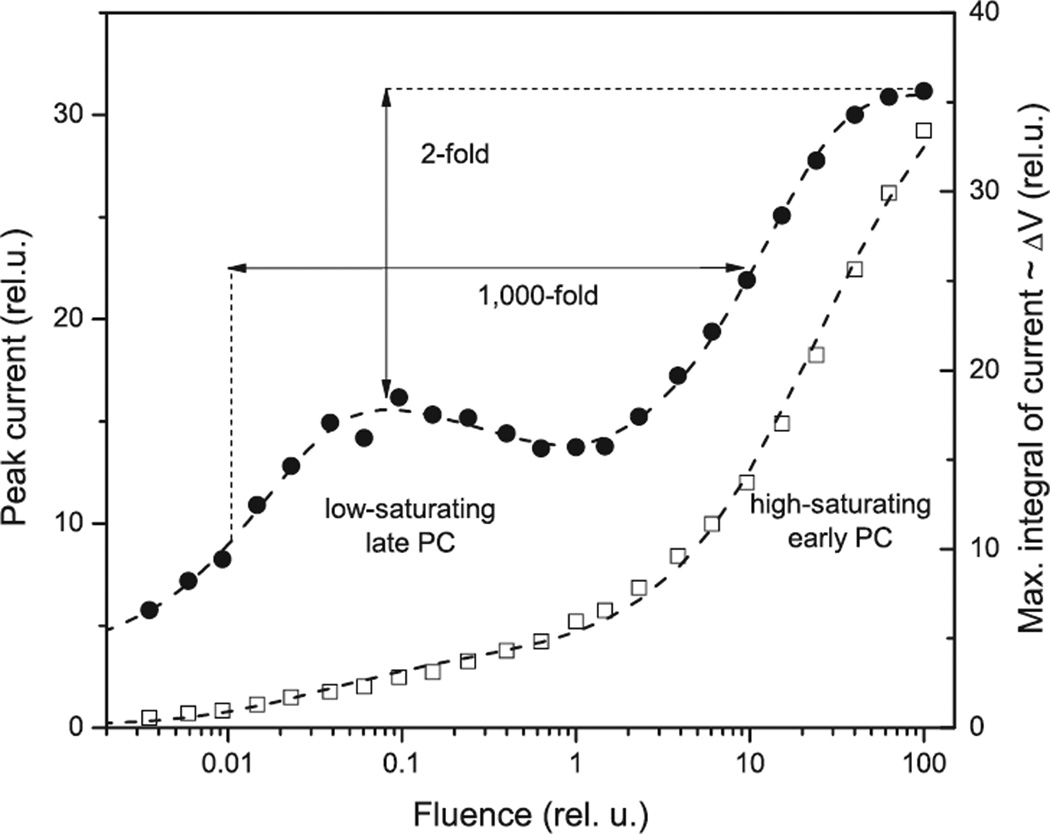
Figure 2.
Fluence dependence of the peak amplitude (open squares) and maximal integral of the photoreceptor currents (filled circles) recorded by the suspension method from Chlamydomonas reinhardtii. Membrane depolarization is proportional to the total charge (the integral of the current over time) transported across the membrane. The arrows indicate the difference of 3 orders of magnitude in the half-saturating stimulus intensities for the early and late photoreceptor currents, and only two-fold increase in the maximal membrane depolarization caused by the early receptor current.

