
Figure 2. Nanoscale topographic cues modulate β1 Integrin levels in HUVEC cells.
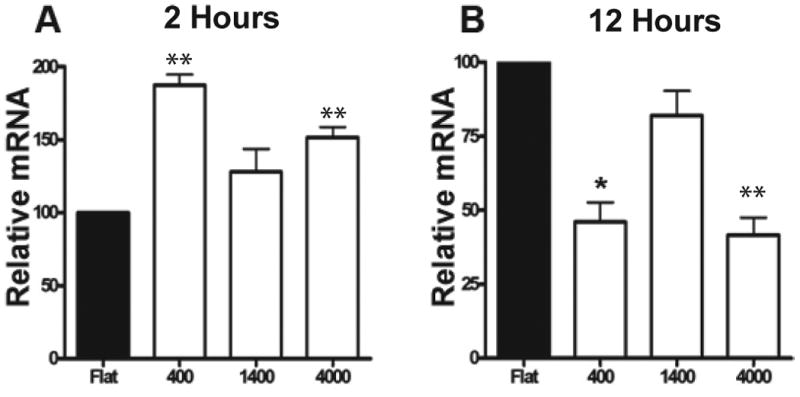
QPCR data of Integrin β1 message from HUVECs seeded onto control flat, 400 nm, 1400 nm and 4000 nm pitch topographies at both 2 and 12 hour time points. Integrin β1 message from HUVEC cells normalized to the Flat condition at (A) 2 hours post-plating and (B) 12 hours post-plating. One way analysis of variance was determined to be significant for both the 2 hour (p<0.0001) and 12 hour (p<0.01) Timepoints. A students t-test was run to determine further significance. *=p<0.05, **=p<0.01, ***=p<0.001 (Data shown as ± SEM)