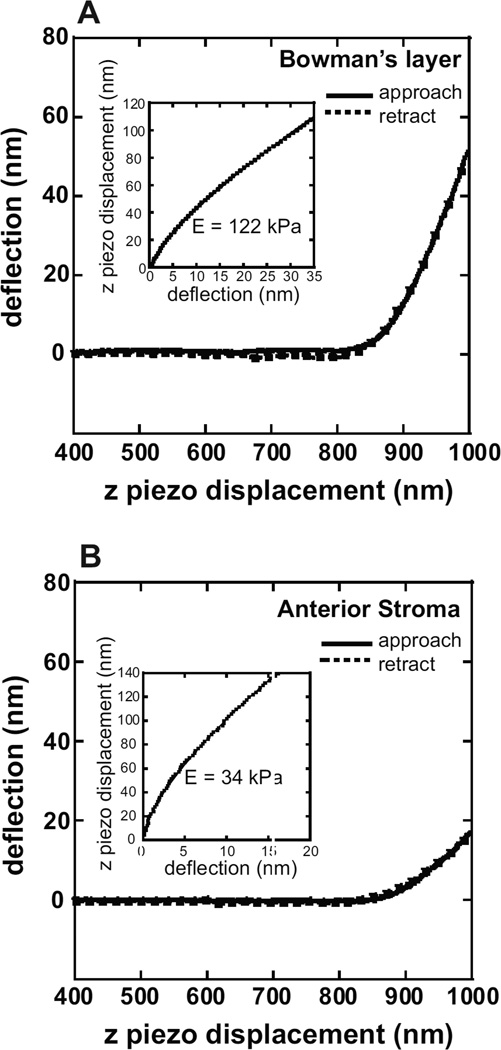
Fig. 2.
Typical force curves obtained from (A) Bowman’s layer and (B) the anterior stroma. The solid line represents the cantilever deflection as the cantilever approaches the surface. The dashed line represents the cantilever deflection upon retraction from the surface. The approach and retract curves overlap, indicating elastic behavior at the indentation rate used (2 μm/sec). Values for the initial contact point of the tip with the sample and the cantilever deflection and z piezo position are obtained from the force curve and used in the Hertz analysis to determine the elastic modulus. Insets: Curve fit of the experimental data (dotted lines) with the Hertz equation (solid line) to determine the elastic modulus.

