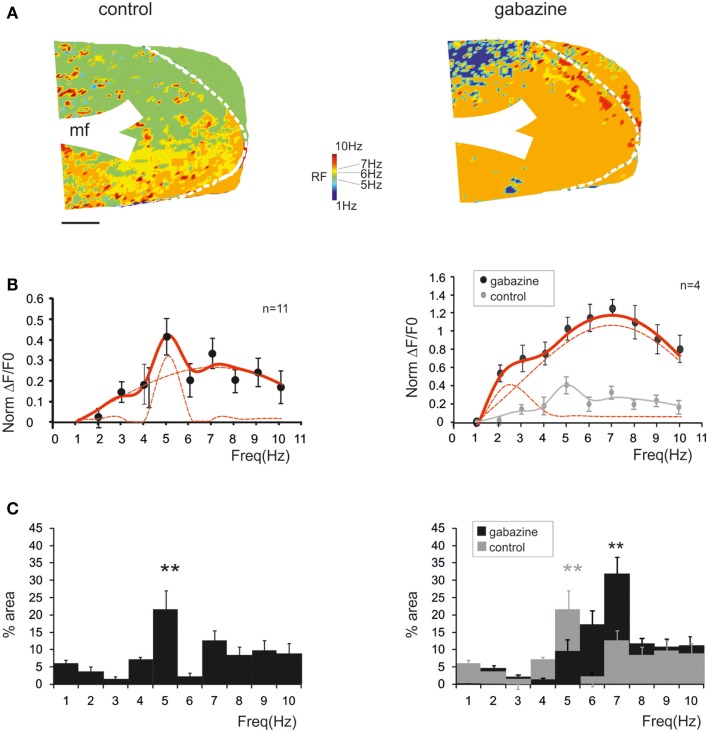
Figure 3.
Synaptic inhibition modulates granular layer (GRL) resonance. (A) The maps show the resonance frequency (RF) for each of GRL pixels before and after application of gabazine. The maps reveal a prevalence of areas showing resonance at 5 and 7 Hz and an increase of the 7 Hz area after gabazine. Scale bar 100 μm. (B) The resonance profiles obtained by all active GRL pixels and averaged over several recordings (n = 11 control and n = 4 gabazine) reveal statistically significant peaks in the 5–7 Hz range. The amplitude of the resonance plot increases after gabazine. (C) Histograms report the relative areas covered by each RF averaged over several recordings (n = 11 control and n = 4 gabazine). Note that the main peak in control occurs at 5 Hz but moves to 7 Hz in the presence of gabazine. Data are reported as mean ± SEM. Red lines fitting the data point represent double Lorentzian functions (broken lines are the two individual component functions) obtained on control and gabazine data, respectively.

