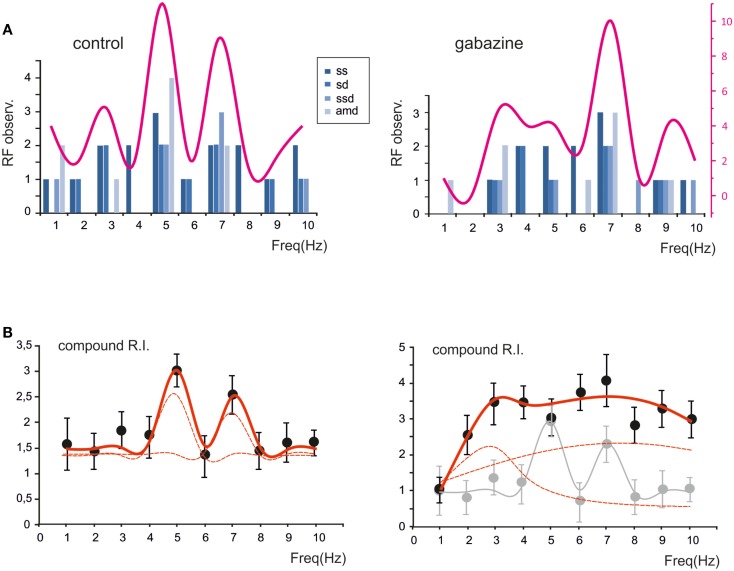
Figure 5.
The global effect of resonance on spike emission in the granular layer network. (A) The histogram shows, for each frequency, the probability of observing a certain RF for spike number, spike delay, spike standard deviation and maximum average depolarization (n = 7). The superimposed plots show, at each frequency, the sum of observations in individual parameters. Note peaks at 5–7 Hz. (B) The plot shows the compound resonance index (RI) calculated from all the neurons recorded in control and in the presence of gabazine. Note peaks at 5–7 Hz. Data are reported as mean ± SEM. Red lines fitting the data point represent double Lorentzian functions (broken lines are the two individual component functions) obtained on control and gabazine data, respectively.

