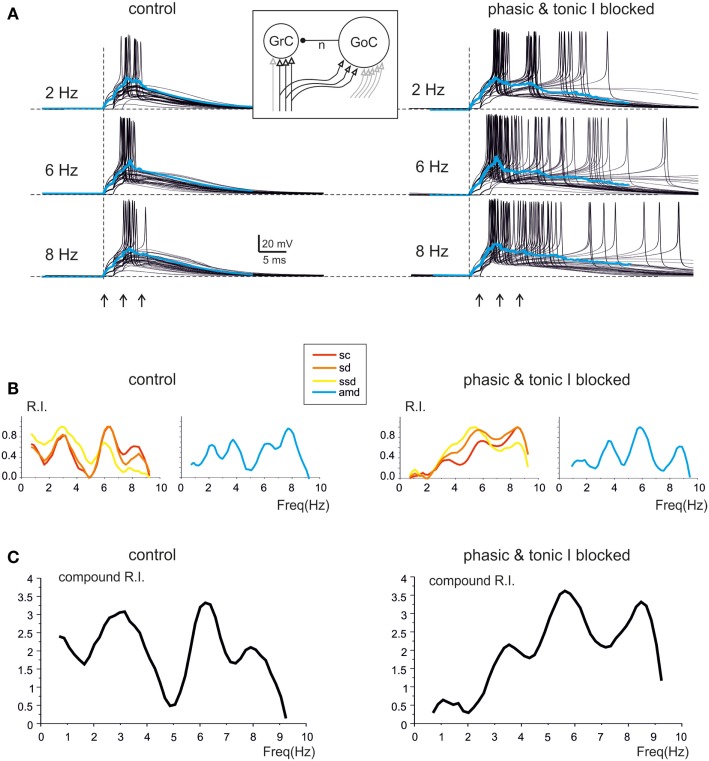
Figure 6.
Modeling resonance in spike emission from single granule cells. Resonance in a model granule cell embedded into the granular layer network model. The traces and plots on the left show the case of two excitatory and two inhibitory synapses and simulate a control experimental condition. The traces and plots on the right have two excitatory synapses, while tonic and phasic inhibition are blocked simulating experimental gabazine application. The mossy fibers in the model are activated with patterns homologous to those used for investigating resonance in acute cerebellar slices (3-spike bursts at 300 Hz repeated 50 times at frequencies ranging from 1 to 10 Hz in 0.5 Hz increments). The inset shows a schematic of the model, with afferent fibers carrying background only (gray) or background interrupted by the bursts (black). (A) The last 45 of 50 sweeps from a single granule cell in the network model are shown superimposed at three different frequencies. Note the increased number, shorter delay and higher precision of spikes at 6 Hz (control and inhibition blocked) compared to the other two frequencies. The average traces are shown superimposed in color. (B) In the same model granule cell as in (A), the R.I. for individual parameters (left: sc, ssd, sd; right: amd) reveal peaks in the theta range. (C) Compound R.I. obtained from the data shown in (B). Both in (A,B) the peak around 7 Hz is enhanced after blocking synaptic inhibition.

