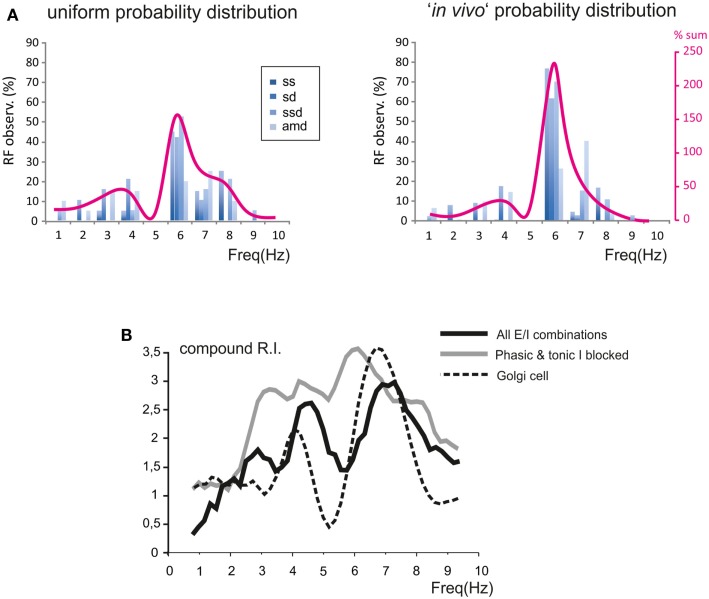
Figure 8.
Modeling the global effect of resonance on spike emission in the granular layer (GRL) network. The global effect of resonance on spike emission in the GRL network has been modeled using different proportional contributions of granule cells with respect to their E/I balance. (A) The histograms show, for each frequency, the probability of observing a certain RF for individual parameters (sc, ssd, sd, amd). The superimposed plots show, at each frequency, the sum of observations in individual parameters. Note peaks at 5–7 Hz as in experimental recordings. In the histogram on the left we assumed a uniform probability distribution of E/I combinations. In the plot on the right we assumed the probability E/I distribution derived from Diwakar et al. (2011) in vivo. (B) The plot shows the compound RI calculated from model simulations using the E/I distribution derived from Diwakar et al. (2011) either including all E/I combinations (black trace) or with phasic and tonic inhibition blocked (gray trace; gabazine effect). Note the similarity of RI plots to those observed experimentally. The compound RI of a Golgi cell in the network (dashed trace) shows a major peak at 6–7 Hz, explaining why inhibition block enhances RI at the same frequencies.

