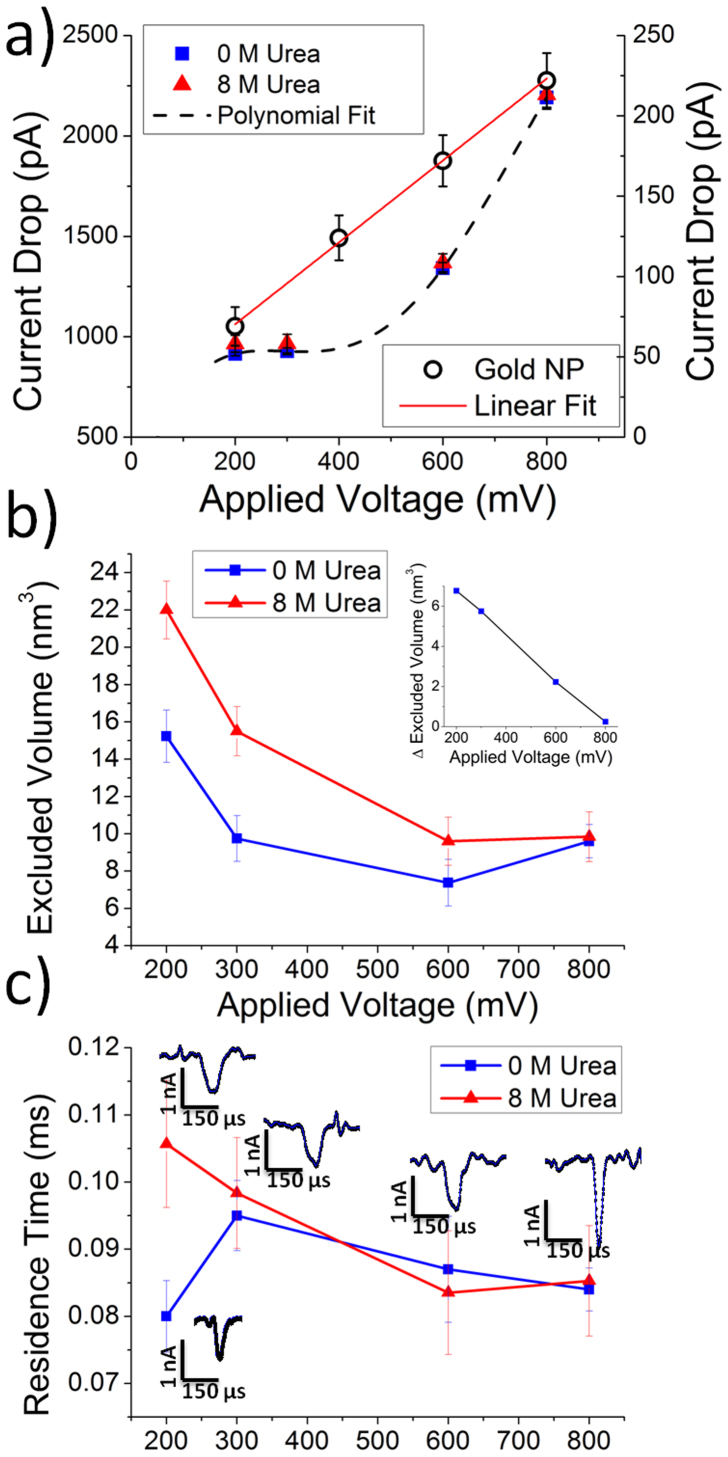
Figure 2.
(a) Current drop parameter plotted as a function of applied voltage with and without urea for the V388A SAP97 PDZ2 domain.Also plotted (right axis) is translocation data for a stable fixed-shape particle (5 nm gold nanoparticles: gold NP) showing a linear dependence with voltage (see Supporting Information for event statistics). (b) Residence time plotted as a function of applied voltage for protein samples with and without urea. Insets: characteristic event traces for corresponding applied voltages at 0 M urea. Residence time histograms are available in the Supporting Information. (c) Calculated excluded volume parameter as a function of applied voltage with and without urea. Insets: the change in excluded volume between the samples with urea and without urea. The experiments were performed in 2 M KCl and 10 mM potassium phosphate buffer (pH 7). Data was collected with the same 15 nm pore at 200 mV (n0M = 1719, n8M = 992), 300 mV (n0M = 703, n8M = 1635), 600 mV (n0M = 768, n8M = 1968), and 800 mV (n0M = 1493, n8M = 5604).

