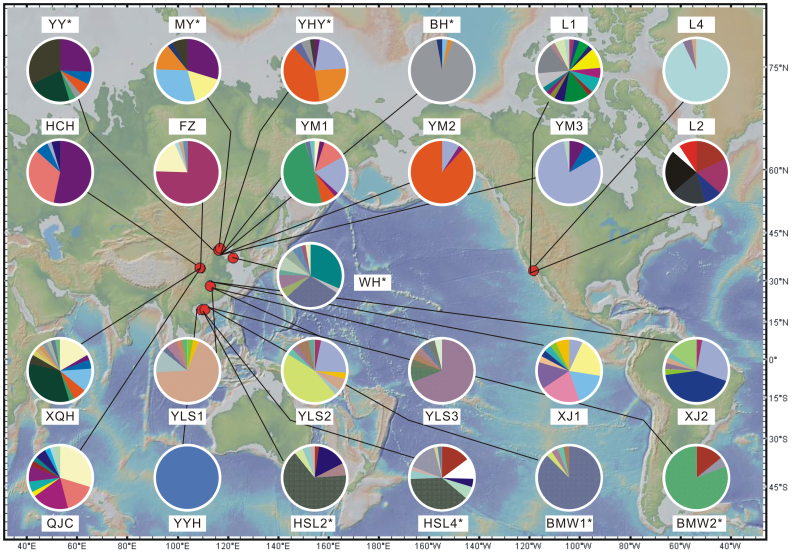
Figure 1. The locations of 16 sampling sites in this study and 9 locations (those with *) from previous study21 that are compared here.
Distribution pies of distinct OTUs (98% similarity threshold) are shown for each site. The sampling sites are described in more detail in Supplementary Table S1 online. The map was generated using GeoMapApp version 2 (http://www.geomapapp.org/).

