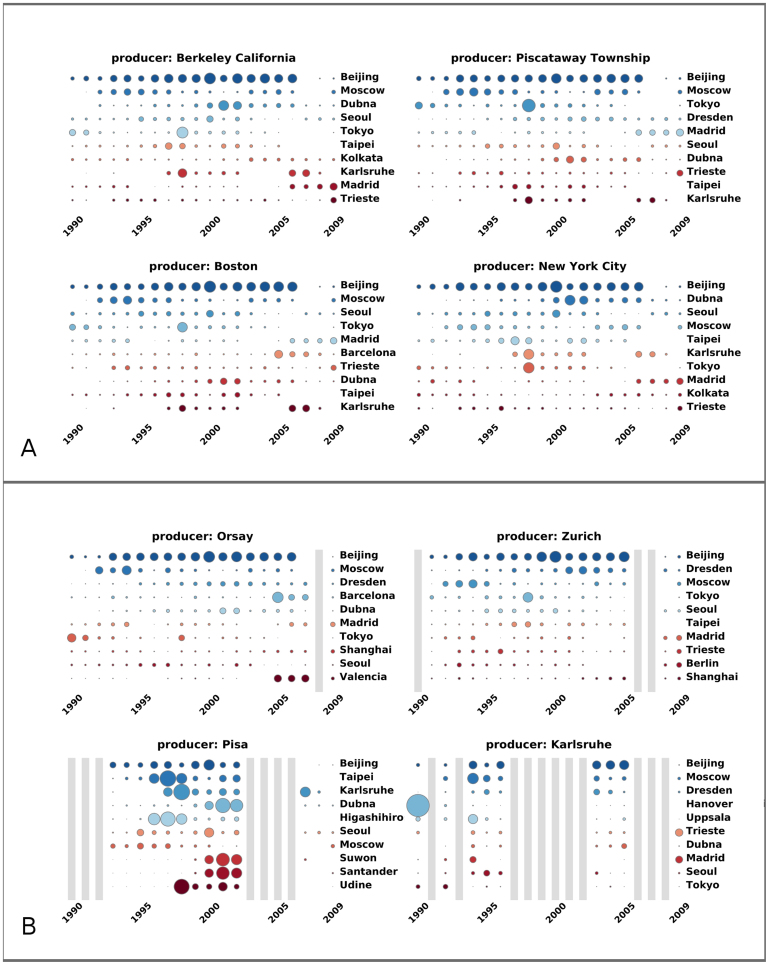
Figure 4. Knowledge diffusion proxy results.
(A) The Top 4 producer cities in the USA in 2009 and their Top 10 consumers from knowledge diffusion proxy algorithm in 1990 – 2009. (B) The Top 4 producer cities in the European Union 27 countries as well as Switzerland and Norway in 2009 and their Top 10 consumers from knowledge diffusion proxy algorithm in 1990 – 2009. When a producer city becomes a consumer in some year, a grey strip is marked in that year. For each producer city in (A) and (B), the major consumers of the first producer city m in 20 years are plotted as a function of time from 1990 to 2009. The size of the bubble in position (Y, c) is also proportional to the counter gm,c(Y) in that year. The consumer cities for each producer are ordered according to the total number of counters in 20 years, i.e.,  .
.

