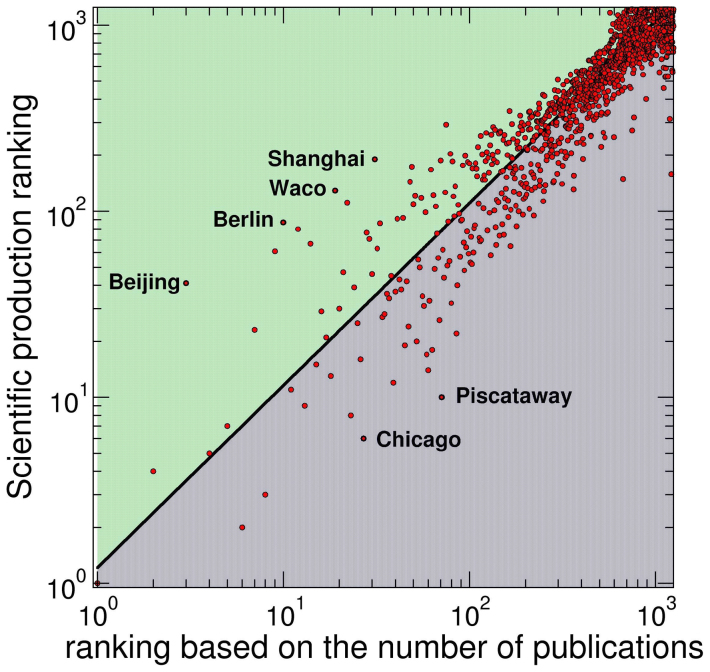
Figure 7. Correlation between scientific production ranking and ranking based on the number of publications in 2009.
The x-axis represents rankings based on the number of papers each city published in 2009, and the y-axis represents the scientific production ranking for each city in 2009. The solid line corresponds to the power-law fitting of data with slope –0.98, and separates the space into two regions. In the region below the line (coloured blue), cities gain better rankings from scientific production ranking algorithm even with relatively less publications, such as Chicago and Piscataway. In the region above (coloured green) cities have lower rankings from the algorithm even they have more papers published, such as Beijing, Berlin, Wako and Shanghai.

