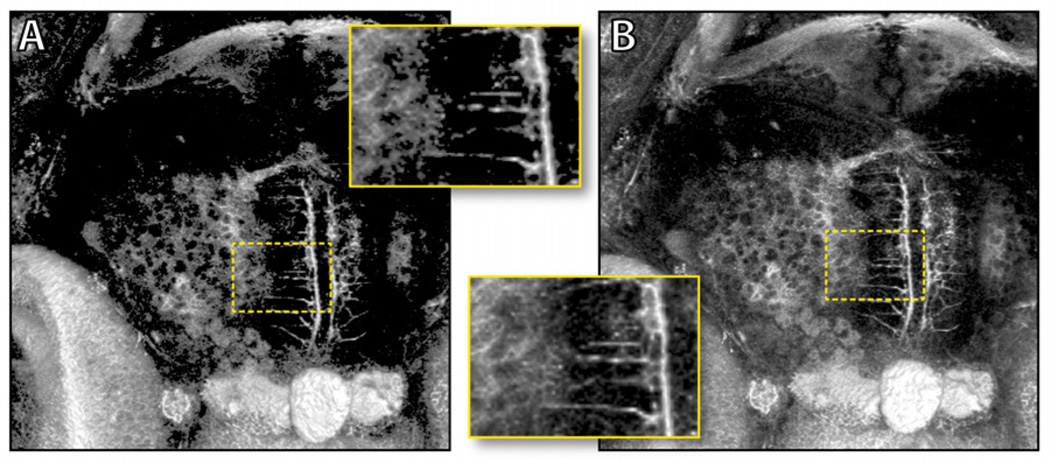
Figure 2.
Results from pre-quantized (A) and on the fly (B) evaluation of the transfer function. The two results are generated with the same transfer function settings. The pre-quantized transfer function clips many details in the low intensity regions, which are preserved with on the fly evaluation of the transfer function. The dataset shows tectal neurons of a 5-day-post-fertilization (5dpf) zebrafish.

