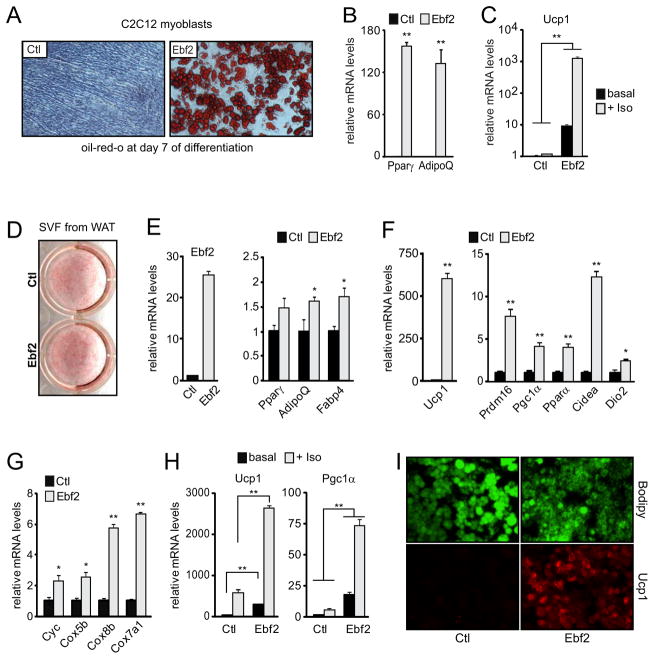
Figure 3. Ebf2 expression drives a brown fat-specific differentiation program.
(A) Ctl- and Ebf2-expressing C2C12 myoblasts were induced to differentiate into adipocytes followed by staining of triglycerides with oil-red-o. (B, C) Above cultures were analyzed for their expression levels of: Pparγ and AdipoQ (B); and Ucp1 levels ± Isoproterenol treatment (C) (n=3). (D–I) Ctl- and Ebf2-expressing white preadipocytes were induced to differentiate into adipocytes followed by staining with oil-red-o (D). (E–H) mRNA levels of: Ebf2 and general adipocyte markers (E); brown-selective genes (F); mitochondrial genes (G); Ucp1 and Pgc1α ± Isoproterenol treatment (H) (n=3–5 pools/construct). (I) Bodipy staining of triglycerides (green) and Ucp1 immunostaining (red). All expression data are: mean ± SD; * p <0.05; ** p <0.01.

