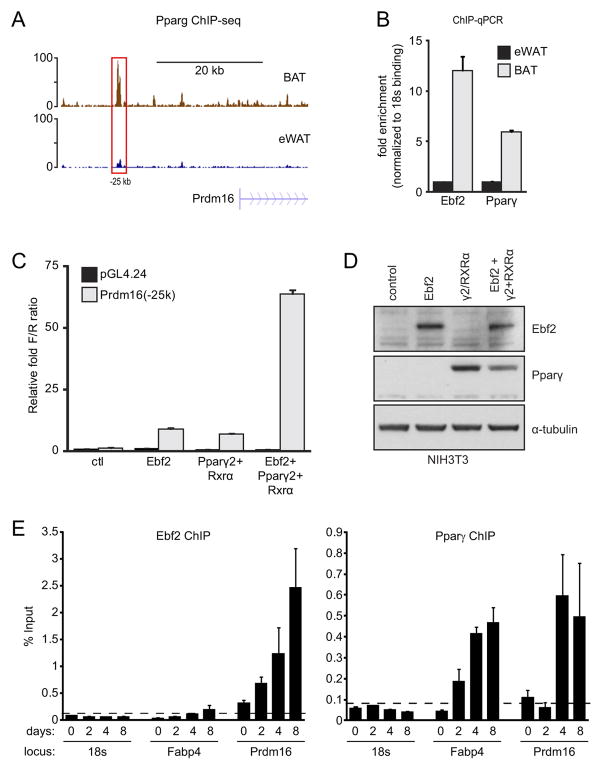
Figure 5. Ebf2 and Pparγ cooperatively activate transcription.
(A) Pparγ ChIP-seq tracks from BAT (brown) and WAT (blue) at the Prdm16 locus. (B) ChIP-qPCR analysis of Ebf2 and Pparγ binding to the −25 kb Prdm16 region (red box in (A)) in eWAT and BAT. (C) Transcriptional activity of the −25 kb region of Prdm16 or control reporter construct (pGL4.24) in response to expression of: Ebf2, Pparγ/Rxrα, or the combination of Ebf2 and Pparγ/Rxrα in NIH-3T3 cells (n=4; mean ± SD). (D) Western blot analysis of Ebf2 and Pparγ levels in NIH-3T3 lysates that were used for transcription assays in (C). (E) ChIP-qPCR analysis of Ebf2 and Pparγ binding to the −25 kb Prdm16 region and Fabp4 during a time-course of brown adipocyte differentiation.

