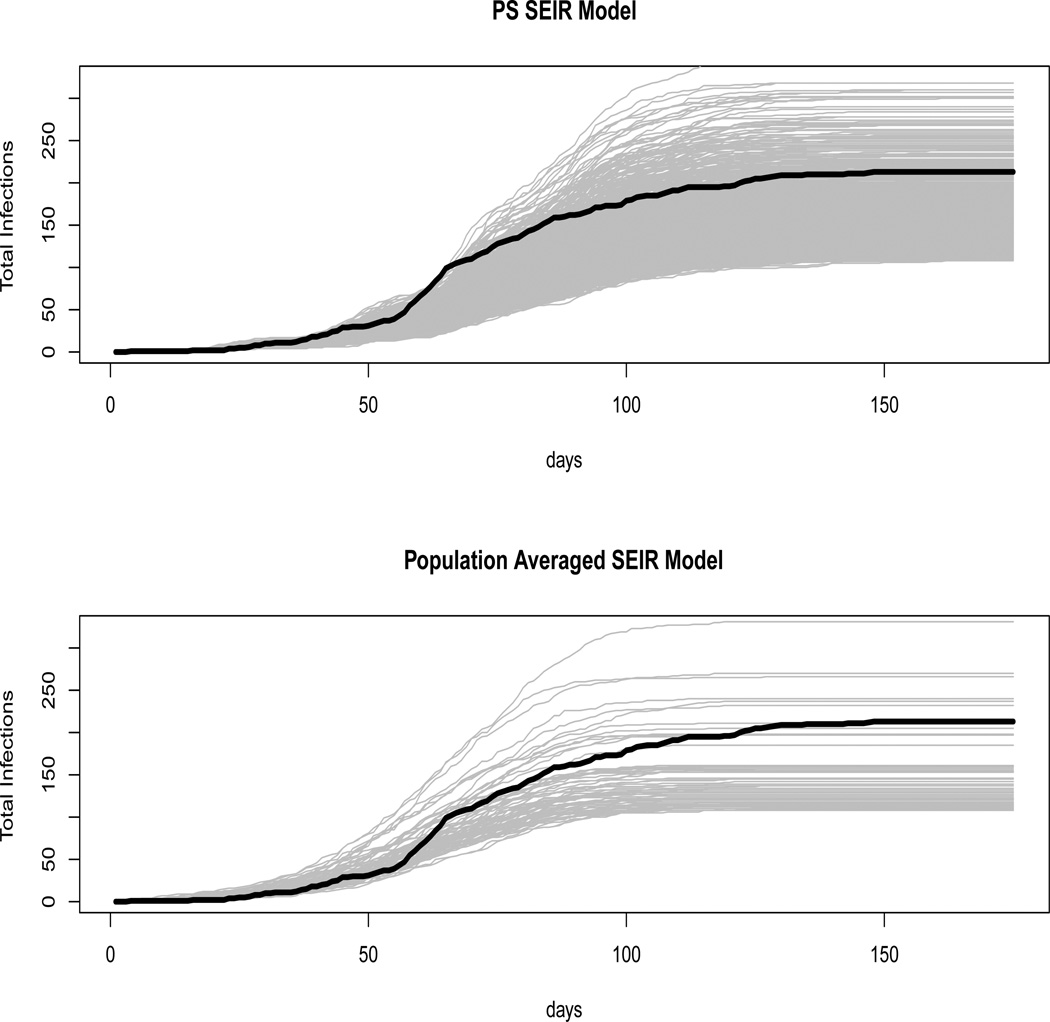
Figure 1.
Upper: Accepted epidemic curves for the PS SEIR model with Weibull latent and infectious times, exponential public health intervention and long infectious distributions. Lower: Accepted epidemic curves for the same population averaged model. Gray curves are model predictions while the black curve is the actual epidemic.

