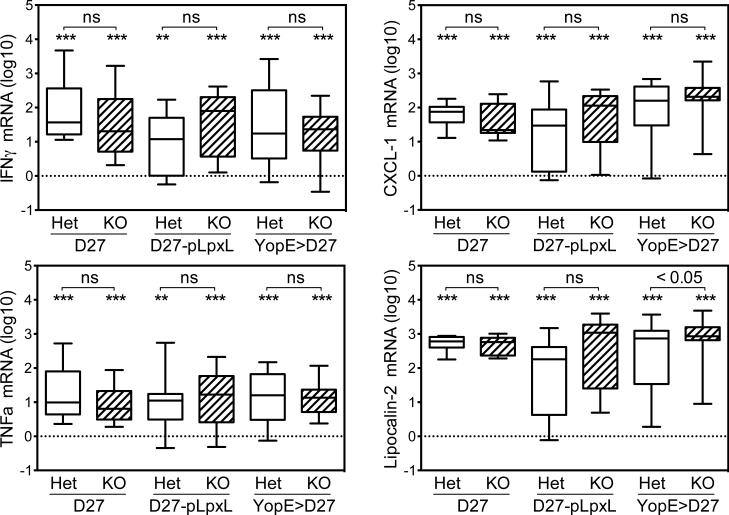
Figure 6. Fibrinogen-deficiency does not reduce infection-induced inflammation.
Real-time PCR data showing levels of mRNA encoding TNFα, IFNγ, CXCL-1 and lipocalin-2 in liver tissue collected four days after control or YopE-immunized mice were challenged with 2×10⁵ CFU Y. pestis strain KIM D27 or 2×10⁶ CFU Y. pestis strain D27-pLpxL. The data is presented as log10 fold-change relative to uninfected wild type mice (n=13) and is pooled from 2-4 experiments (n=9-20 mice/group). Box and whisker plots show the maximum, minimum, median, 25th percentile, and 75th percentile. The dotted line depicts the mean value for uninfected wild type mice. Asterisks depict statistical comparisons of each group to the uninfected wild type mice using Student's t-tests (* p<0.01, ** p<0.001, *** p<0.0001). ns = not significant (p>0.05).

