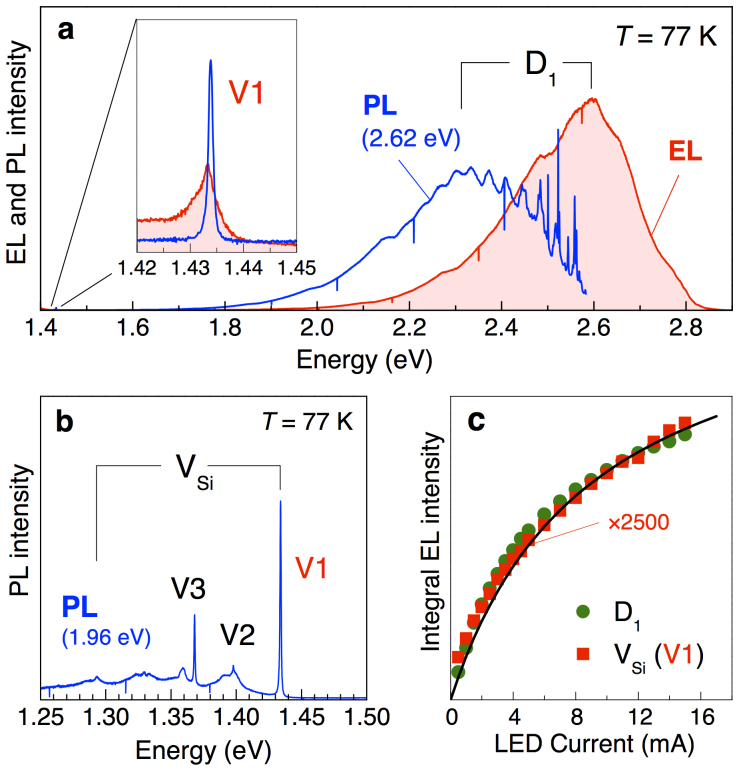
Figure 3. EL and PL spectra of SiC LED recorded at 77 K.
(a) Comparison of the EL (shaded area) and PL spectra under excitation with an energy Eexc = 2.62 eV (473 nm). Inset: The same, but shown in the spectral range where the strongest VSi ZPL (V1) is expected. (b) PL spectrum obtained under excitation with a He-Ne laser with Eexc = 1.96 eV (633 nm). The V1, V2 and V3 ZPLs characteristic for the VSi defects in SiC are clearly seen. (c) Integral intensity of the VSi and D1 emission bands [the shaded areas in (a)] as a function of LED current. The solid line is a fit (see text for details).

