Figure 3.
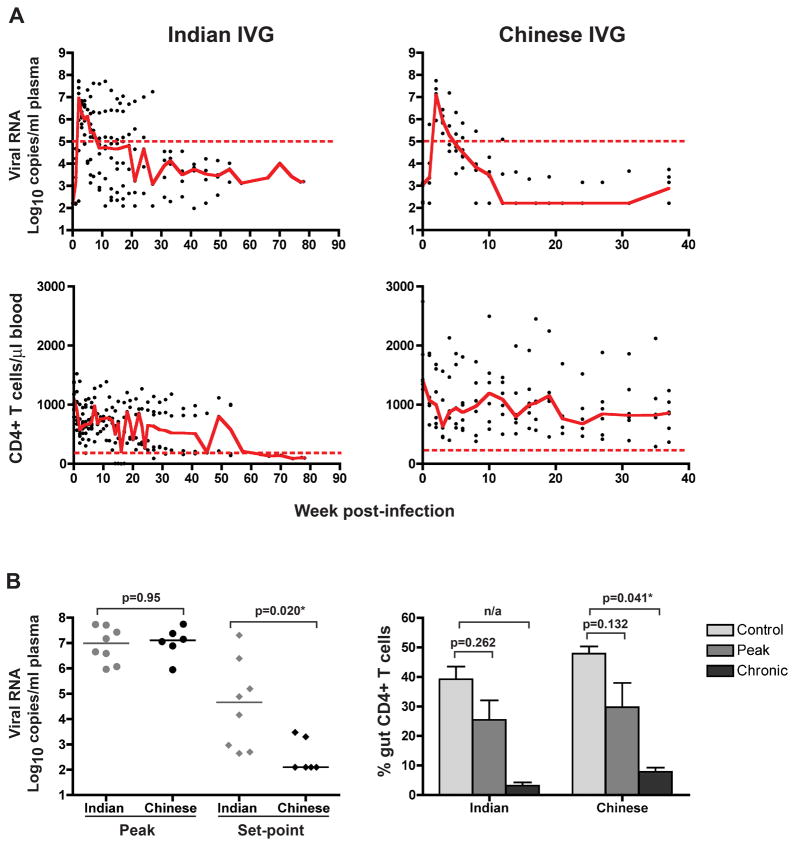
Comparison of the changes in viral load (VL) and CD4+ T cell levels over time (A), and peak, set-point and gut CD4+ T cell depletion (B) in Indian and Chinese RMs infected intravaginally with R5 SHIVSF162P3N. Trend lines in (A) were created using the median VL or CD4 count values at each time point, and the dashed lines marked a set-point of 5 log10 RNA copies/ml plasma or a CD4+ T cell count of 200 cells/ul blood. The horizontal bars in (B) represent median values, and the control gut CD4+ T cell counts were generated from 3 and 12 uninfected Indian and Chinese origin rhesus respectively, with error bars indicating mean and standard deviations. n/a, statistics analysis for the ivg-infected Indian RMs at set-point viremia could not be determined because data from only two animals were available.

