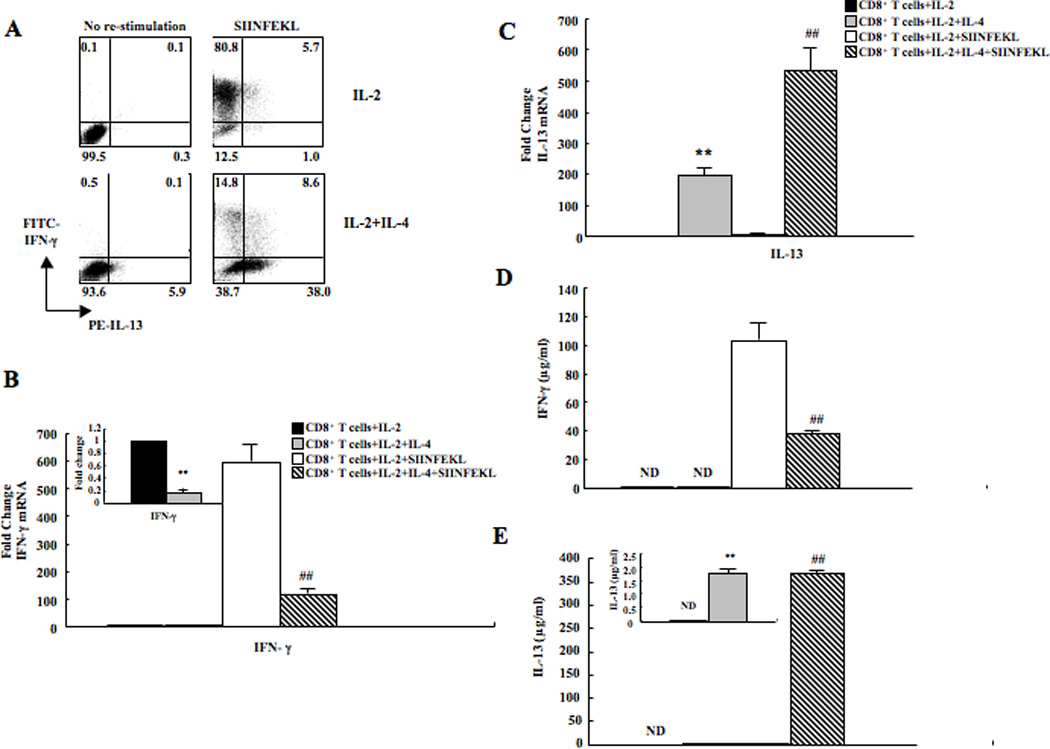
Figure 4. IFN-γ and IL-13 expression in CD8+ T cells differentiated in IL-2 or IL-2+IL-4 in vitro.

(A) Representative results of intracellular staining of IFN-γ and IL-13 expression in CD8+ T cells with or without SIINFEKL re-stimulation. (B) IFN-γ mRNA levels in CD8+ T cells. (C) IL-13 mRNA levels. (D) IFN-γ protein levels. (E) IL-13 protein levels. Data (mean±SEM) are from 6–10 independent experiments. **p<0.01, *p<0.05 compared to the IL-2 group, ##p<0.01 compared to the IL-2+SIINFEKL group.
