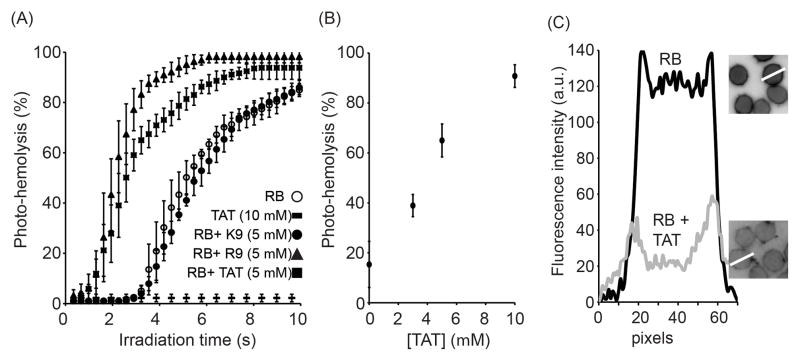
Figure 3.
TAT and R9 enhance the photolytic activity of Rose Bengal (RB). A) Photohemolysis monitored as a function of irradiation time. RB (200 nM) was incubated with RBCs and photohemolysis was assessed by bright field microscopy. B) Photohemolysis mediated by RB as a function of the concentration of TAT present. Photohemolysis was measured after exposing the cells with 560 nm light for 4 s. C) Fluorescence intensity profiles of RBCs incubated with RB alone or with RB and TAT (10 μM). Fluorescence images of the cells are represented as inverted monochrome. White lines highlight the regions of interest from which the intensities were measured. Membrane intensities were calculated for 10 different RBCs and the data was consistent for each cell.

