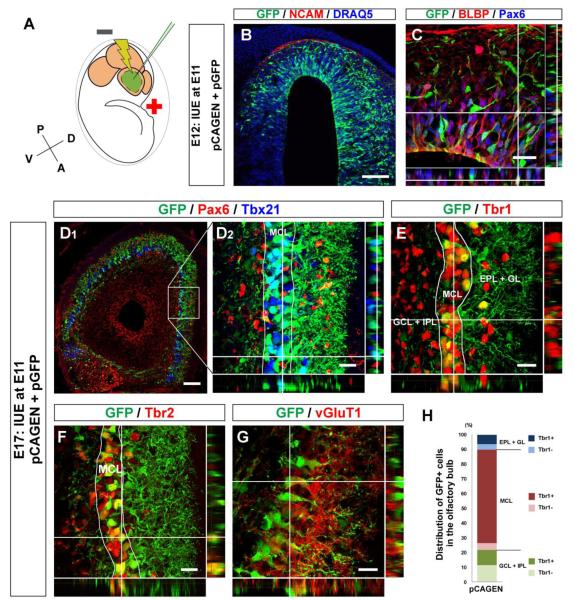
Figure 3. Introduction of plasmid vectors into mitral cell precursors with in utero electroporation.
(A) Schematic diagram of in utero electroporation. Negative current (two 50 ms pulses of 30 V with 950 ms intervals) was applied from posterior to anterior in embryonic mouse brain after injection of plasmid vectors into lateral ventricle to electroporate the embryonic OB cells. All electroporations shown in this study were performed at E11. (B, C) Horizontal sections of E12 OB electroporated with pCAGEN and pGFP at E11. GFP+ cells (Cy2, green) are found in presumptive OB defined with NCAM+ olfactory sensory axons (red). All nuclei were stained with DRAQ5 (blue) (B). The section immunostained with Pax6 (Alexa 647, blue) and BLBP (Alexa 555, red). GFP+ cells (Cy2, green) expressing both Pax6 and BLBP are located in VZ. (D – G) Horizontal sections of E17 OB electroporated with pCAGEN and pGFP. GFP+ cells (Cy2, green) are mostly negative for Pax6 (D; Alexa 555, red), and localize in the mitral cell layer (MCL) that is defined with Tbx21 (D; Alexa 647, blue). These GFP+ cells express Tbr1 (E; Alexa 555, red), Tbr2 (F; Alexa 555, red), and vGluT1 (G; Alexa 555, red). (H) Graph showing distribution and Tbr1 expression of GFP+ cells in E17 OB electroporated with pCAGEN and pGFP. Based on DRAQ5 and Tbr1 staining, layers in the OB were divided into three parts; glomerular and external plexiform layers (GL + EPL), MCL, and internal plexiform and granule cell layers (IPL + GCL) (E). Numbers of GFP+ cells and GFP+ cells expressing Tbr1 were counted, and percentages of Tbr1+ and Tbr1− GFP+ cells among total GFP+ cells were calculated in each part. The graph was made by averaging the data acquired from 4 OBs. Scale bars, 200 μm in (B) and (D1); and 20 μm in (C) and (D2 – G).

