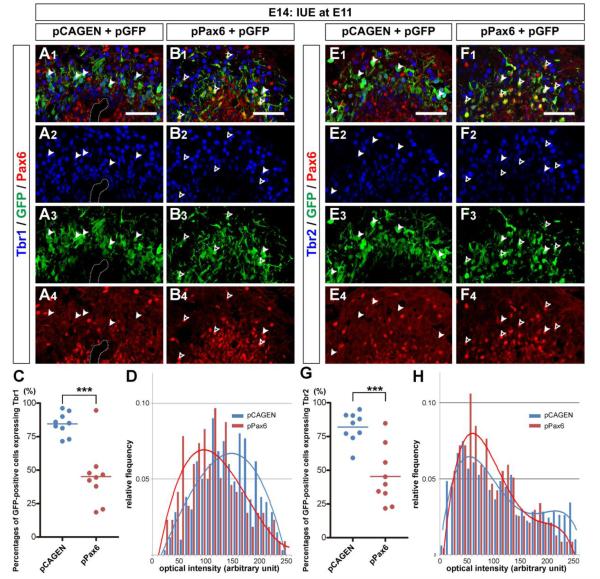
Figure 5. Exogenous expression of Pax6 impairs expressions of Tbr1 and Tbr2 in embryonic olfactory bulb.
(A, B) Sagittal sections of E14 OBs electroporated with pCAGEN (A) or pPax6 (B) together with pGFP. The sections were immunostained with anti-Tbr1 (Alexa 647, blue) and anti-Pax6 (Alexa 555, red) antibodies. GFP+ cells (Cy2, green) electroporated with pCAGEN are mostly localized in IZ and express Tbr1, but not Pax6 (A; closed-arrowheads). In contrast, many GFP+ cells electroporated with pPax6 are found in VZ. While all of them are Pax6+, some are Tbr1+ (B; closed-arrowheads). GFP+ cells that do not express Tbr1 are also found (B; open-arrowheads). Damaged region with a hole in the section shown in (A) is encircled with dotted lines. (C) Scatter plots showing percentages of Tbr1 expressing cells among GFP+ cells in E14 OB electroporated with pCAGEN (n=9) or pPax6 (n=9). The percentage is significantly decreased by pPax6 electroporation (***p<0.0005; unpaired t test). (D) Histogram of optical intensity (arbitrary unit) of Tbr1 in GFP+ cells electroporated with pCAGEN (blue) or pPax6 (red). Only GFP+ cells that were counted as Tbr1+ in (C) were used for the analysis. Trendlines were overlaid in the graph. (E, F) Similar to Tbr1 expression, Tbr2 (Alexa 555, red) is expressed by most of GFP+ cells (Cy2, green) electroporated with pCAGEN (E; closed-arrowheads), while both Tbr2+ (F; closed-arrowheads) and Tbr2– (F; open-arrowheads) cells are found among GFP+ cells electroporated with pPax6). (G) Scatter plots showing percentages of Tbr2 expressing cells among GFP+ cells in E14 OB elctroporated with pCAGEN (n=9) or pPax6 (n=9). The percentage is significantly decreased by pPax6 electroporation (***p<0.0005; unpaired t test). (H) Histogram of optical intensity (arbitrary unit) of Tbr2 in GFP+ cells electroporated with pCAGEN (blue) or pPax6 (red). Only GFP+ cells that were counted as Tbr2+ in (G) were used for the analysis. Trendlines were overlaid in the graph. Scale bars, 50 μm.

