
FIGURE 6.
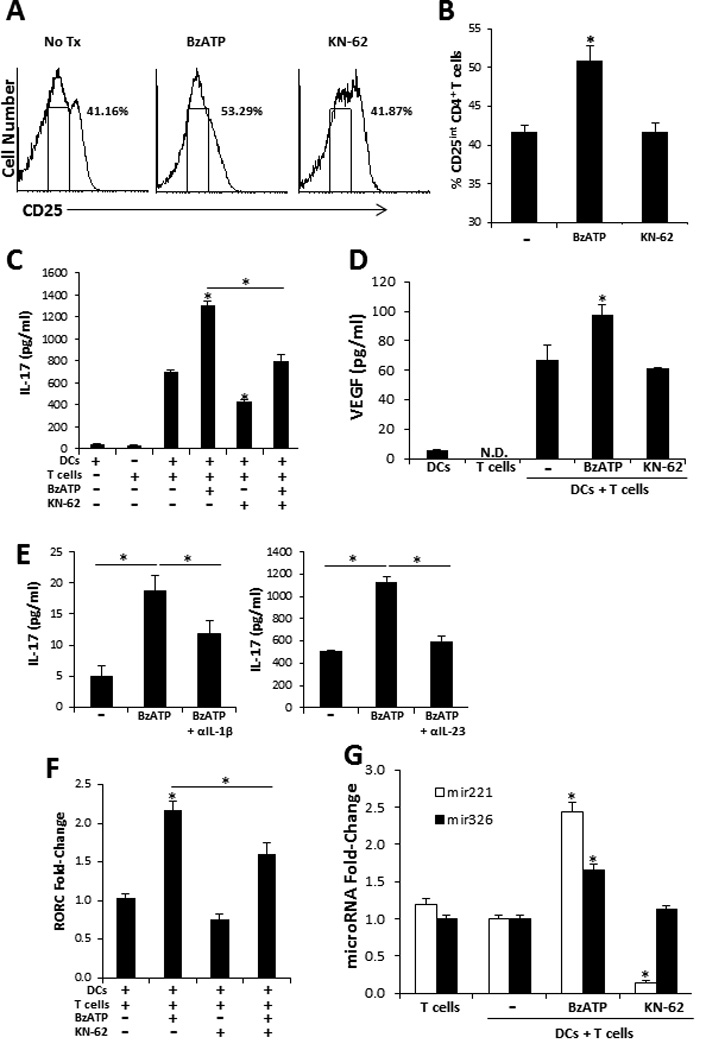
P2X7R-stimulated smiDCs significantly increase effector Th17 biased responses. Responder allogeneic naïve CD4+ T cells were cultured with BzATP-, KN-62-, BzATP + KN-62-, or non-stimulated-smiDCs for 1 or 5 d. (A) Following 5 d culture CD25 expression was examined by flow cytometry. CD25 histograms represent cells that were gated on CD4. Gated region on histogram represents intermediate CD25 expression, characteristic of effector CD4+ T cells. (B) The percentage of cells expressing CD25int graphically illustrated, bars represent the mean ± SD of triplicates. (C) IL-17 and (D) VEGF were detected in supernatants from 5 d MLCs and (E) MLCs stimulated with BzDCs were treated with IL-1β or IL-23 neutralizing Abs for 5 d then IL-17 levels were assessed by ELISA. Bars represent the mean ± SD from replicates. Controls are smiDCs and naïve T cells alone. (F) RORC mRNA transcripts and (G) microRNAs were detected 1 d following initial co-culture. Bars are the mean ± SD from triplicates and are expressed as the fold-increase compared to no treatment control (−) as determined by the 2−ΔΔCt method. Data are representative of 3–11 independent experiments. Asterisk indicates a significant difference compared to non-treated DC + T cell controls (−), unless otherwise indicated, p < 0.05. N.D. non-detected.