
Figure 2.
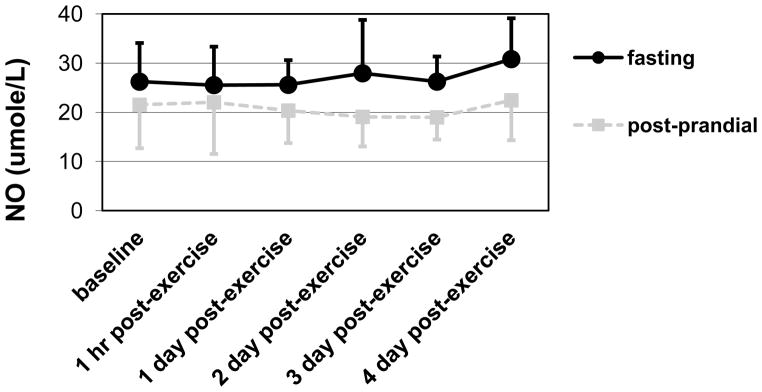
Means and standard deviations for NO showing higher levels in the fasting group than the post-prandial group regardless of time (main effect of GROUP; p = .01, η2 = .22).
Official websites use .gov
A
.gov website belongs to an official
government organization in the United States.
Secure .gov websites use HTTPS
A lock (
) or https:// means you've safely
connected to the .gov website. Share sensitive
information only on official, secure websites.
Means and standard deviations for NO showing higher levels in the fasting group than the post-prandial group regardless of time (main effect of GROUP; p = .01, η2 = .22).